
Analysing Friction Score & Behaviour Difference
How to identify friction points by comparing the behaviour in abandoned and completed sessions
The most important audience segmentation you can run on your form is between visitors that successfully complete your form and those that abandon it. If you can identify a meaningful behavioural difference between these two groups for a particular field then you’ve probably found an important friction point that is causing people to drop out.
Zuko has been designed to surface this friction. When looking at your data in the Zuko App you’ll come across references to “Friction Score” in the Insights report and also in Field Data. So what is that and what does it mean?
What is Friction Score?
In Zuko, Friction Score is specifically related to return rate for individual fields. Return rate means the percentage of visitors who return to a field after they’ve already entered information (usually to make a correction or change). The Friction Score is simply the variation in this metric for completers and abandoners.
For example, in the field returns table below 19.9% of abandoners return to make a change to the ‘Username’ field. The figure for completed sessions is 15.78%, a ‘Friction Score’ of 4.1% (essentially one figure minus the other).

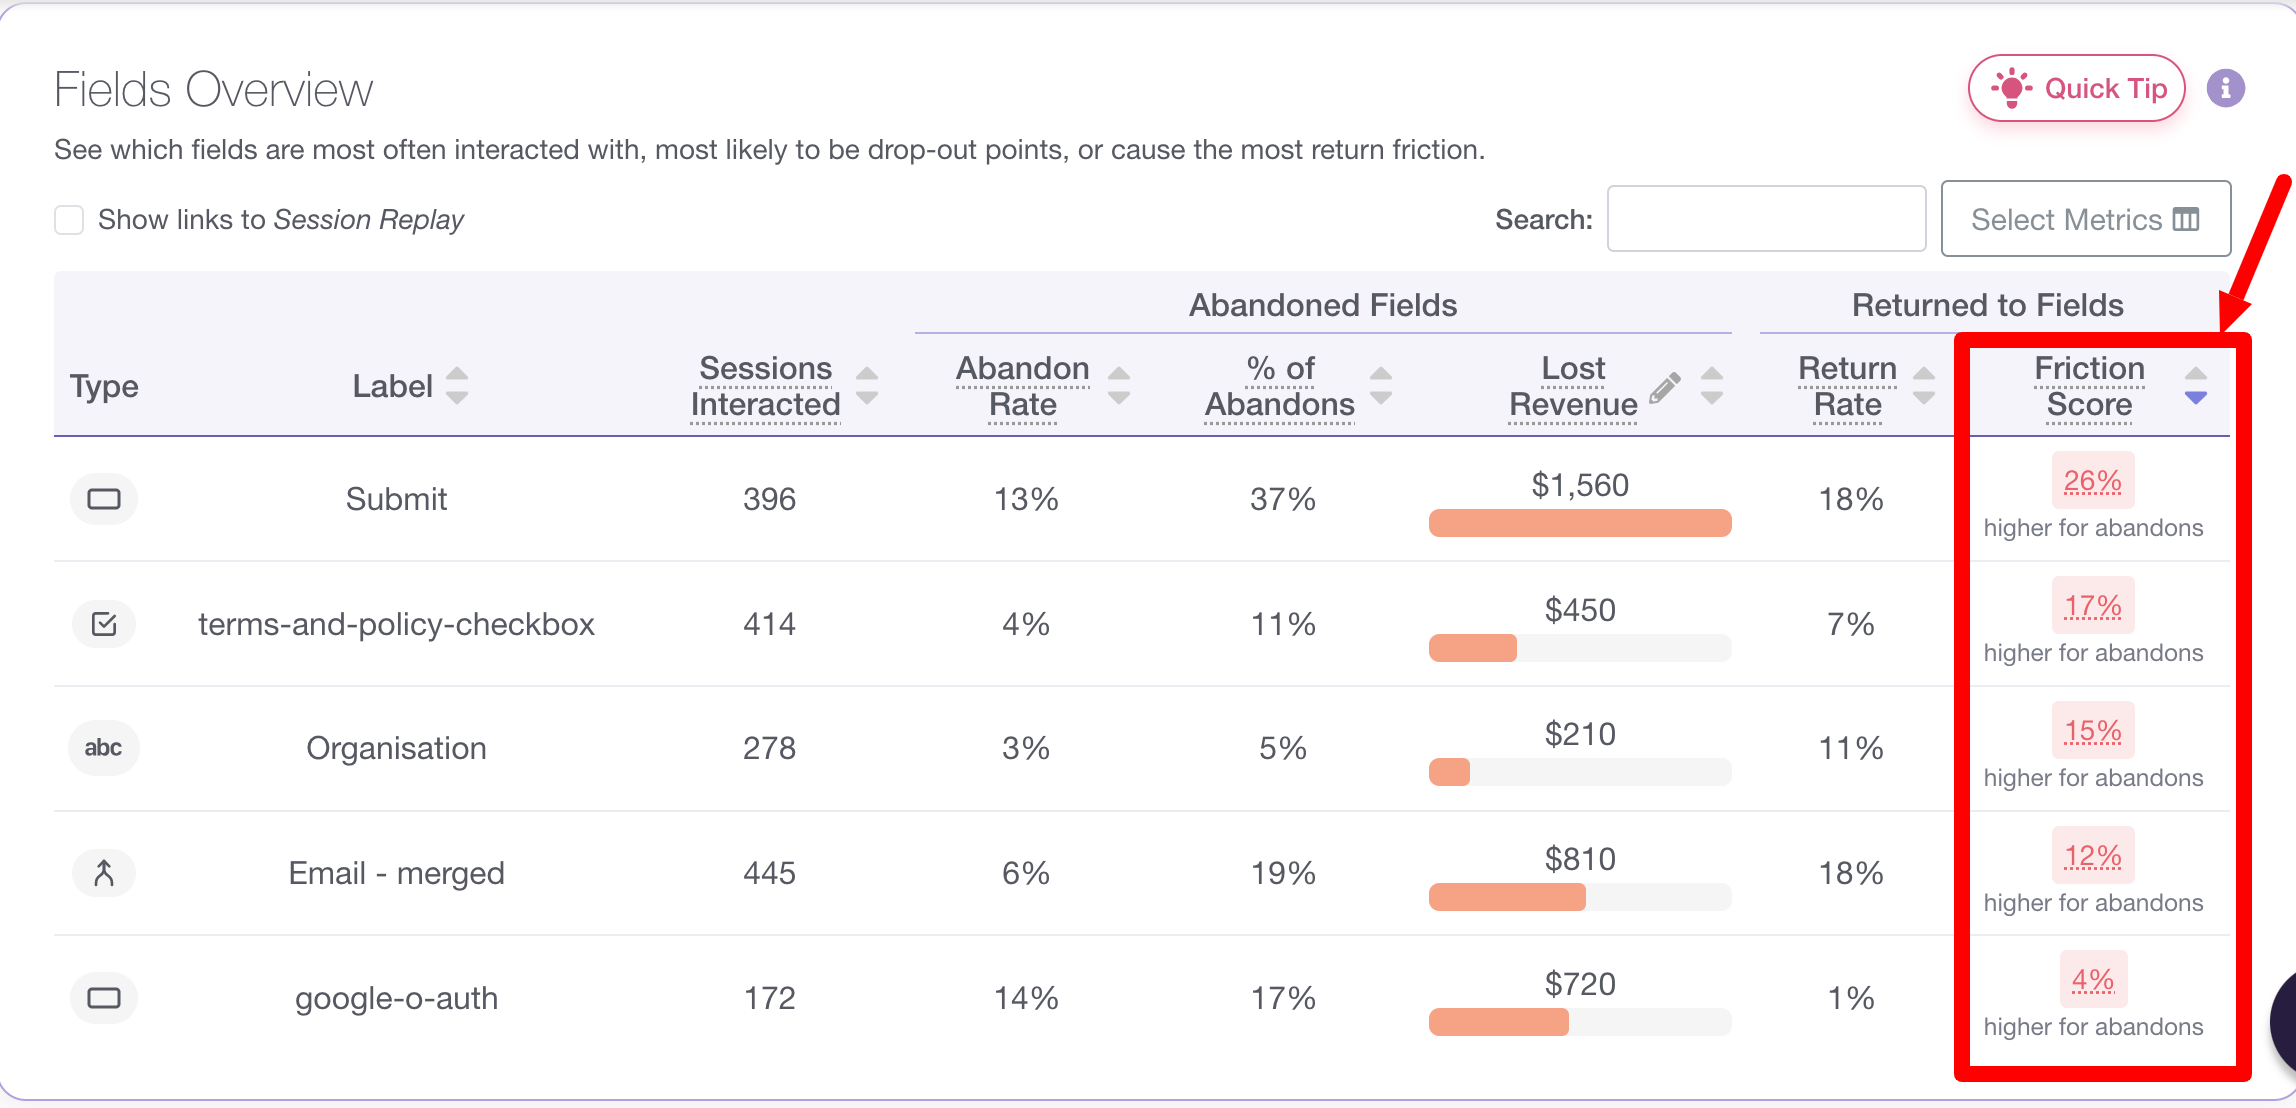
In the field data report, Zuko will highlight whether the difference is statistically significant (pink if abandoners is higher, blue if completers is higher). This significance is calculated to a 95% confidence level.
How do you interpret Friction Score?
Return rate is generally a key indicator of friction. That is often the case but isn’t always so. Sometimes a high return rate may be naturally high and isn’t correlated with visitor abandonment (think personal statements on university applications where applicants come back to hone their answer).
Friction Score / Behaviour difference is where you tease this out. If the field return figure is significantly greater for Abandoned sessions than Completed sessions, this is a clear indication that the field is disproportionately causing visitor struggles that ultimately lead to abandonment (this is the pink highlight).

If there are many fields with statistically significant differences you’ll want to be looking at the ones with the highest differentials. Zuko’s Insights report will automatically pull out the 3 top fields for this metric:

The reverse situation (blue highlight - completers return at a higher rate than abandoners) is less common but is an interesting situation. It is still an indication that the field has its issues (potentially linked to the required format of the answer or the clarity of explanation / error message) but it essentially means that, in this case, there is a segment of visitors who are sufficiently motivated to work through any issues themselves and make the necessary corrections - they really want what you are offering. There is also another subset (who end up as abandoners) who are less motivated - they can’t be bothered and give up after one try.
In the example below, people who really want to buy from this eCommerce provider are going back to correct their card number after rejection. Those that are maybe “tyre kickers”, just testing out the user journey don’t bother.

Want to get started with Zuko?
Start a free trial that includes all features, or request a demo