
Zuko Form Conversion Benchmarking Data
We’ve been tracking and optimising forms for over a decade and we’re sharing a wide range of form behaviour metrics from our database for you to explore and use however you want. It’s data you won't be able to find anywhere else; you can explore a wide range of metrics across various industries, form types, devices and browsers. You can find various reports below that illustrate differences in data taken from the millions of sessions we've tracked. How does your online form stack up?
If you have any questions or would like to learn more about Zuko’s benchmarking data or how Zuko can help you improve the completion rate of your forms please contact us on sales@zuko.io
About the Data
Find out more about the data we've used to go into our benchmarking study. Get a breakdown of industries, form types, browsers and device types. Click to see more.
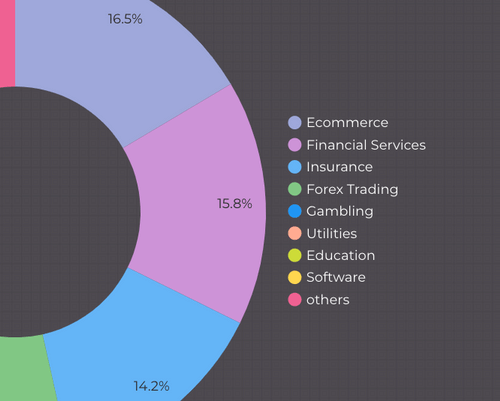
Industry Benchmarking
Compare industry form performance across a wide range of form metrics, including average form completion rate, time to complete, and more. Click to start exploring the data.

Form Type Benchmarking
Compare the performance of different types of form, such as application, purchase, registration across a range of Zuko metrics. Click to see more on different form types.

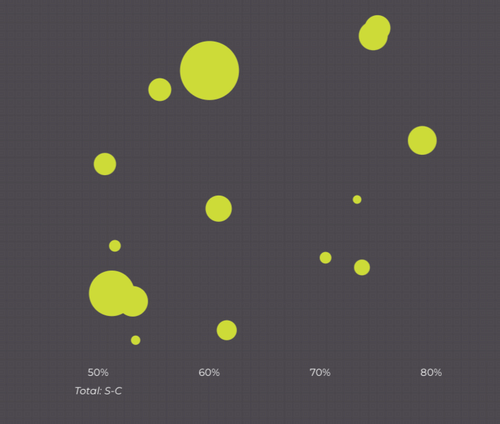
Form Performance Analysis
Explore how different form performance metrics affect each other - for example compare the number of form fields with the average number of field returns. Click to find out more.
We wrote the book on form optimization!
"The best book on form design ever written - 80 pages of PURE GOLD"

Zuko is the world's most powerful form analytics solution
If you or a client has a form on their website that is a vital part of an online experience, then we can help make it better. Using data and insight, we can pinpoint areas for improvement and finally give you all the tools you need to make that experience the best its ever been.