Form Abandonment Data by Industry Sector

Average Conversion Rate Statistics by Industry 2025

Here you can see charts showing how conversion / abandon rates for forms in different industries compare based on data from Zuko’s form optimization database.

The categories which had enough forms to aggregate were:

Automotive

Charity

Data Services

Ecommerce

Education

Financial Services

Forex Trading

Gambling

Healthcare

Insurance

Media

Misc (a catch all)

Property

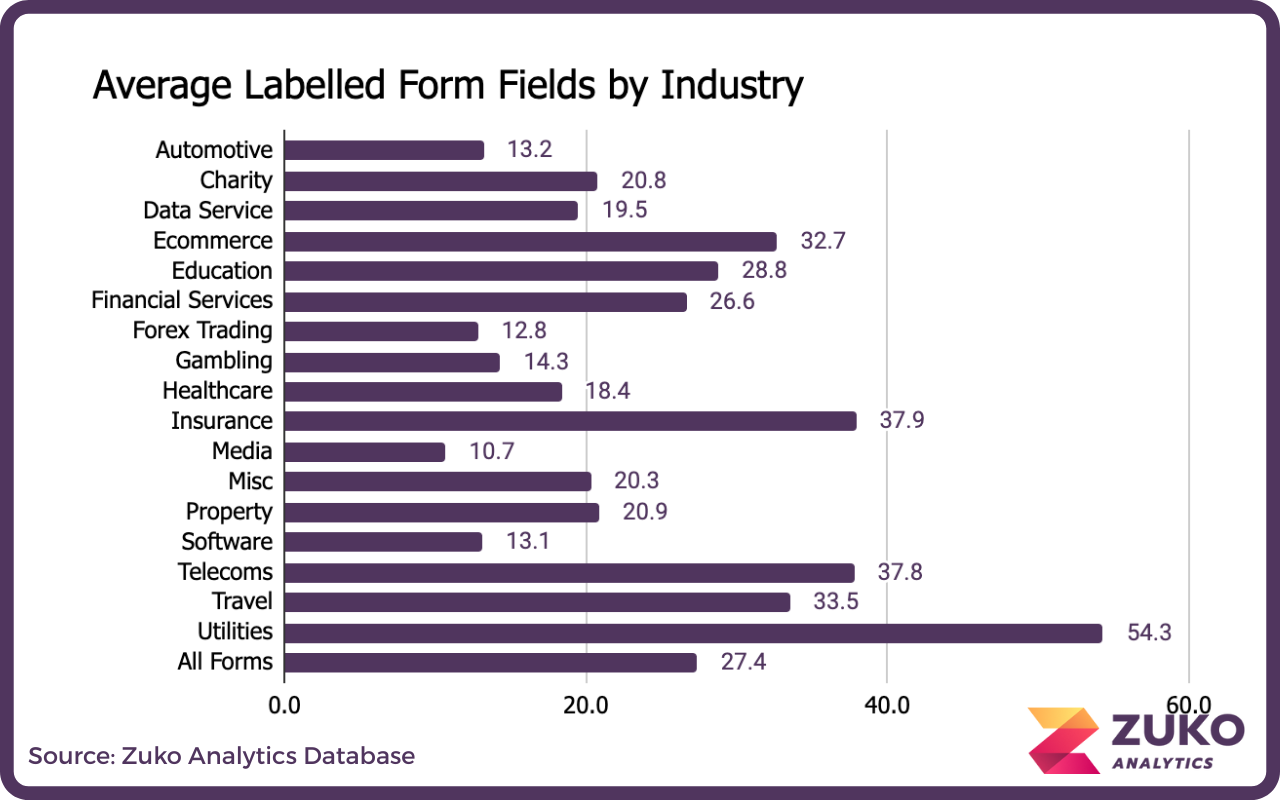
Firstly, we can see the average length of each form (based on field volumes). Insurance is way ahead of the pack with media forms typically being the shortest.

Bar chart showing average labelled form fields by industry, with Utilities highest at 54.3 and Media lowest at 10.7.

Industry Sessions Tracked Desktop Conversion % Mobile Conversion % Tablet Conversion % Overall Conversion %
Automotive 767,502 46.18% 43.79% 41.61% 44.78%
Charity 3,013,288 61.84% 53.43% 57.93% 56.86%
Data Service 5,170,413 61.00% 51.31% 57.38% 56.51%
Ecommerce 14,699,493 54.28% 49.44% 53.84% 50.95%
Education 1,791,672 52.75% 43.23% 43.60% 47.68%
Financial Services 27,089,063 60.75% 53.71% 56.98% 58.38%
Forex Trading 13,553,625 72.38% 63.84% 63.99% 67.35%
Gambling 13,484,926 53.87% 54.02% 55.11% 54.13%
Healthcare 727,492 49.87% 40.82% 37.04% 44.37%
Insurance 5,323,610 56.79% 47.80% 50.84% 55.81%
Media 236,742 36.07% 34.52% 40.46% 36.29%
Misc 537,459 46.51% 40.46% 32.99% 44.22%
Property 1,048,638 40.86% 31.09% 29.83% 34.55%
Software 557,487 53.53% 38.61% 46.70% 50.61%
Telecoms 2,201,755 47.68% 42.02% 49.51% 47.80%
Travel 1,506,125 61.58% 59.43% 56.77% 60.51%
Utilities 1,175,713 44.38% 42.54% 39.65% 43.38%
All Forms 93,022,997 54.48% 47.53% 49.31% 51.71%

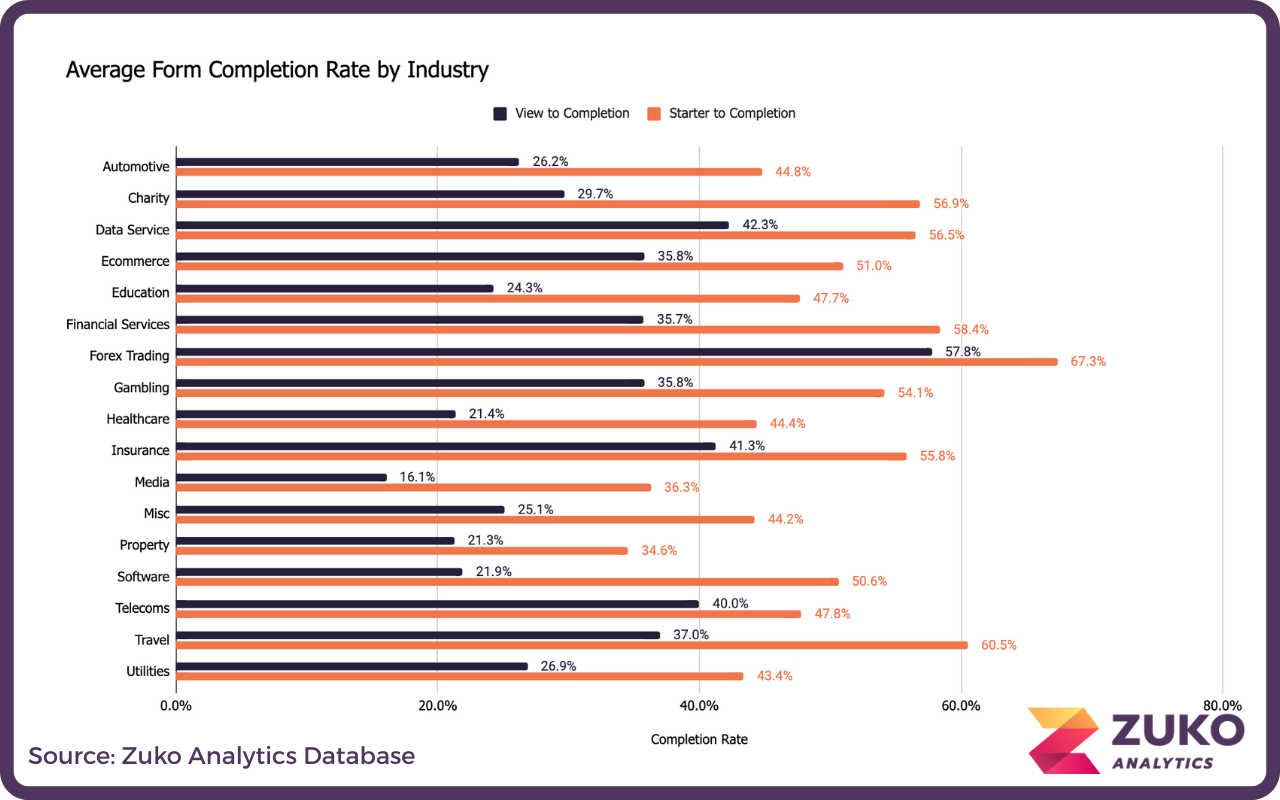
Completion rates by industry in the chart below and the table above. Note that a high proportion of the Forex Trading forms on Zuko’s database were multi-step forms that were set up as single forms so, overall, we would expect that the start-to-finish completion rate of Forex forms would be much lower. Based on data for Forex Multi-step forms, we expect that the View to Completion Rate to be around 20% and the Starter to Completion Rate to be around 30%.

Bar chart showing average form completion rates by industry with two metrics: View to Completion and Starter to Completion; Forex Trading has the highest Starter to Completion rate at 67.3%, and Healthcare has the lowest View to Completion rate at 21.4%.

This chart then breaks down the conversion by device. In all industries (bar Gambling) desktop users convert at a higher rate than mobile users. The overall completion figures are:

View to Completion - Desktop 37.2%, Mobile 31.3%

Starter to Completion - Desktop 55.5%, Mobile 47.5%

Bar chart showing industry form completion rates by device type for Desktop, Mobile, and Tablet across various industries like Automotive, Charity, Data Service, Ecommerce, Education, Financial Services, Forex Trading, Gambling, Healthcare, Insurance, Media, Misc, Property, Software, Telecoms, Travel, and Utilities.

The same figures for browser type with Chrome having the highest Starter to Completion Rate and Samsung the lowest.

Bar chart showing industry form completion rates by browser for Safari, Chrome, Samsung, Firefox, and Opera across various industries like Automotive, Charity, Data Service, and more, with Opera generally having the highest rates.

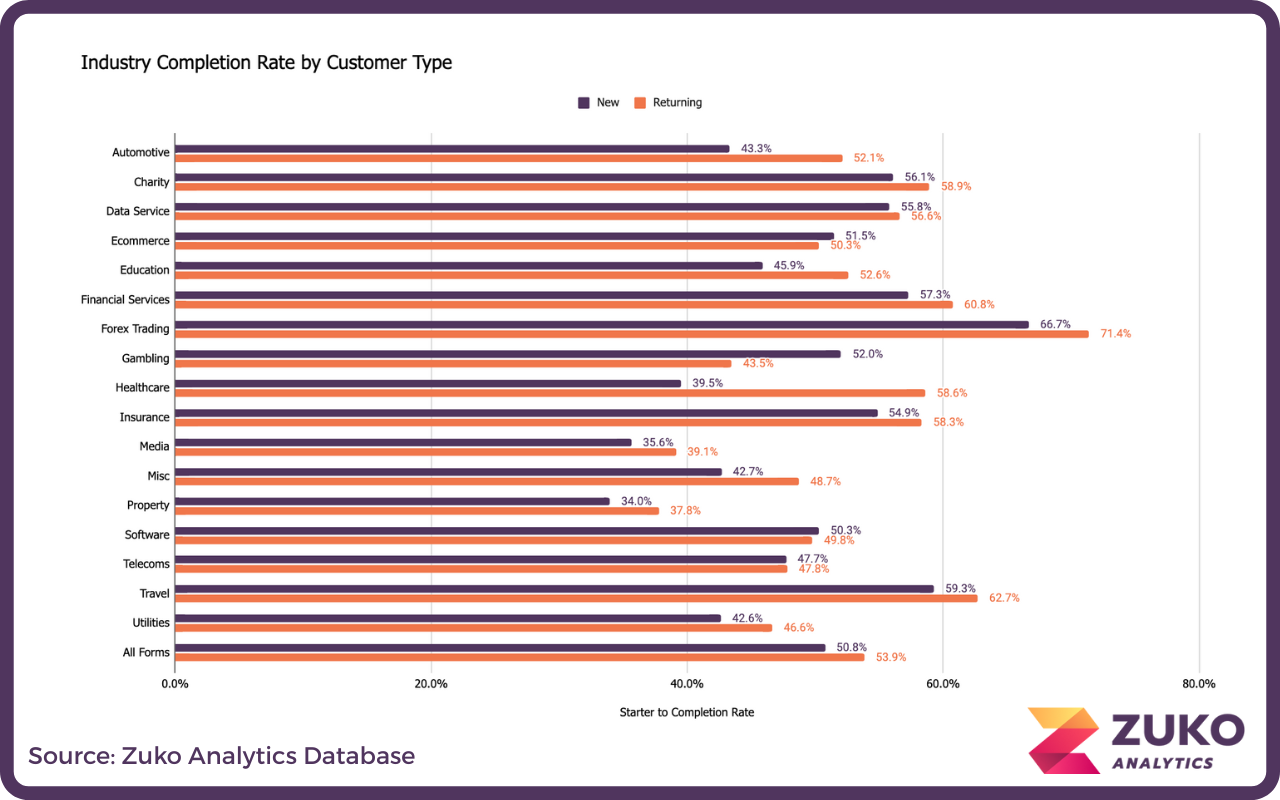
Returning users convert at a higher rate than new ones (but not by much):

Bar chart showing industry completion rates by customer type for new and returning customers across sectors like Automotive, Charity, Data Service, Ecommerce, and more, with returning customers generally having higher completion rates.

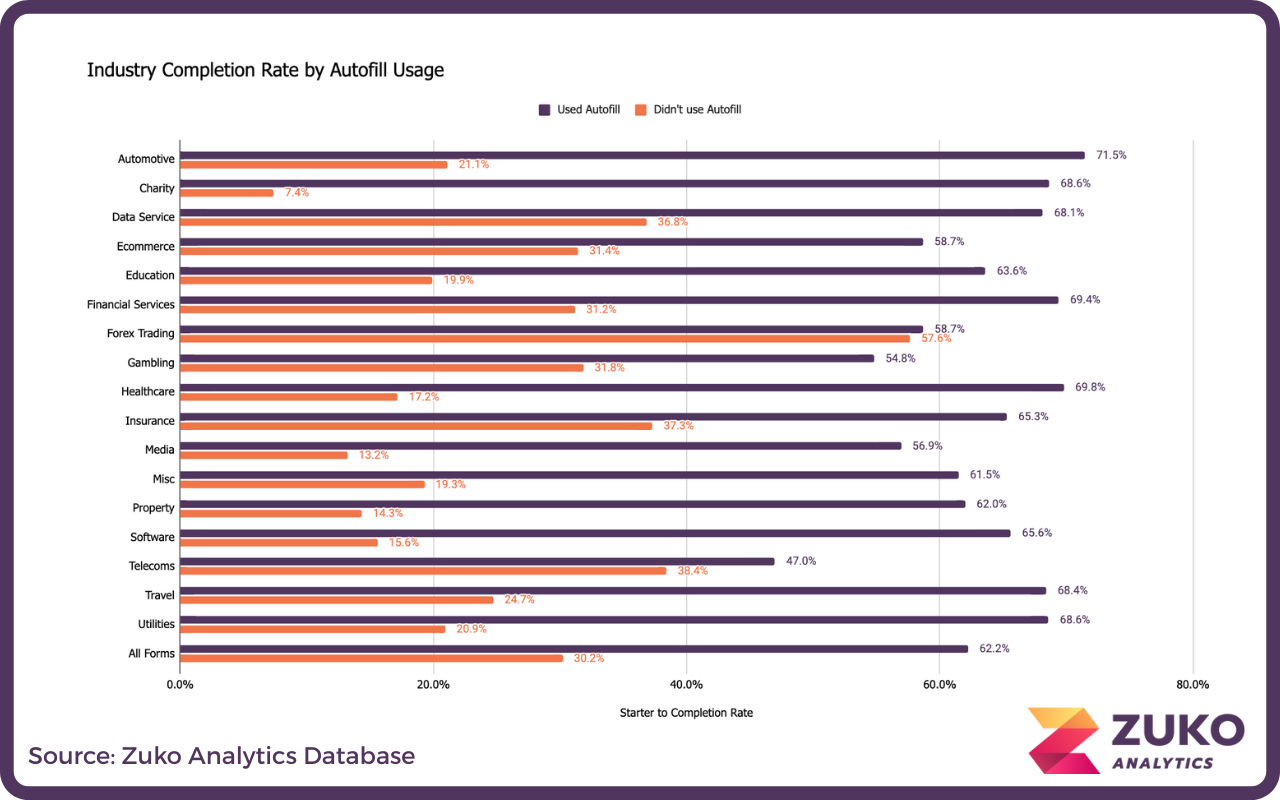
The use of autofill is clearly correlated with successful form completion.

Bar chart showing industry completion rates by autofill usage; automotive industry has highest autofill completion at 71.5%, telecoms lowest at 47%.

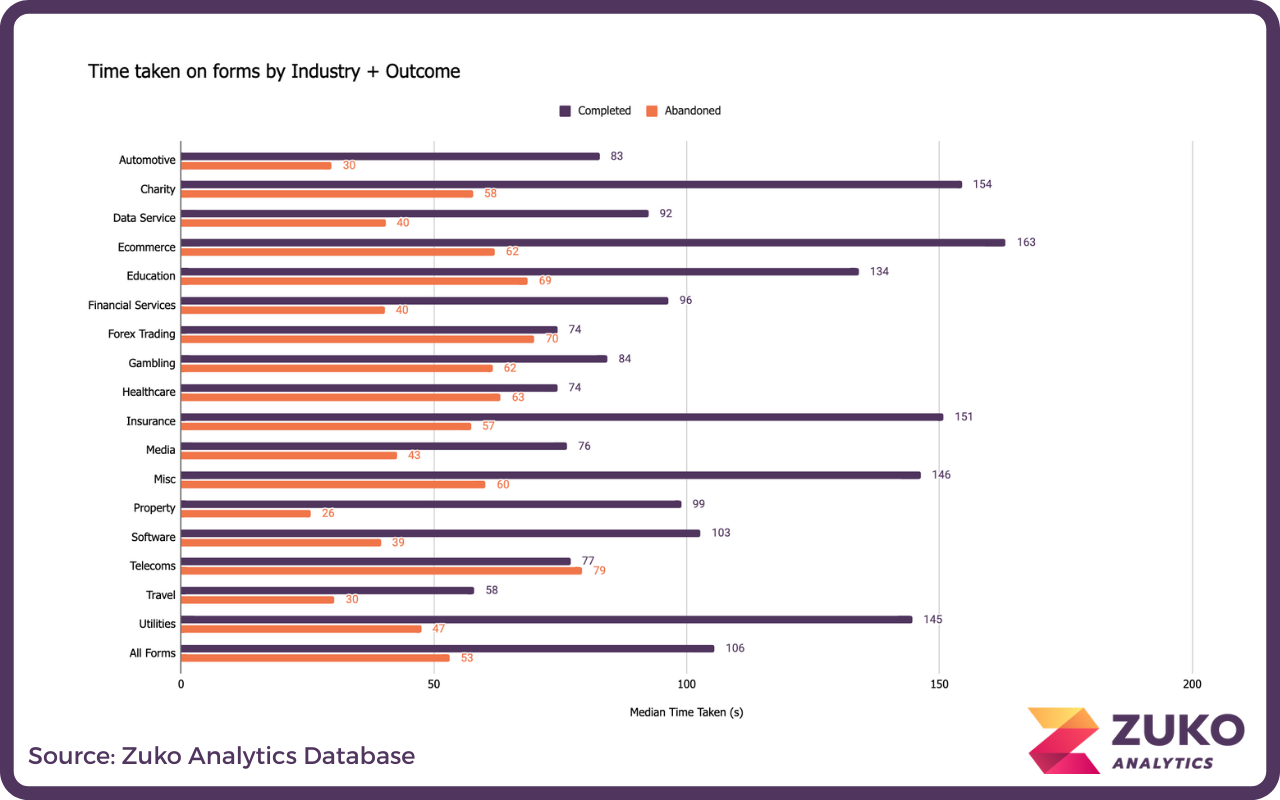
As you might expect, completed forms take longer than abandoned sessions. Charity, eCommerce and Insurance forms took the longest to complete.

Bar chart showing median time taken in seconds to complete or abandon forms by industry, with ecommerce and charity having the highest completion times and telecoms having the highest abandonment time.

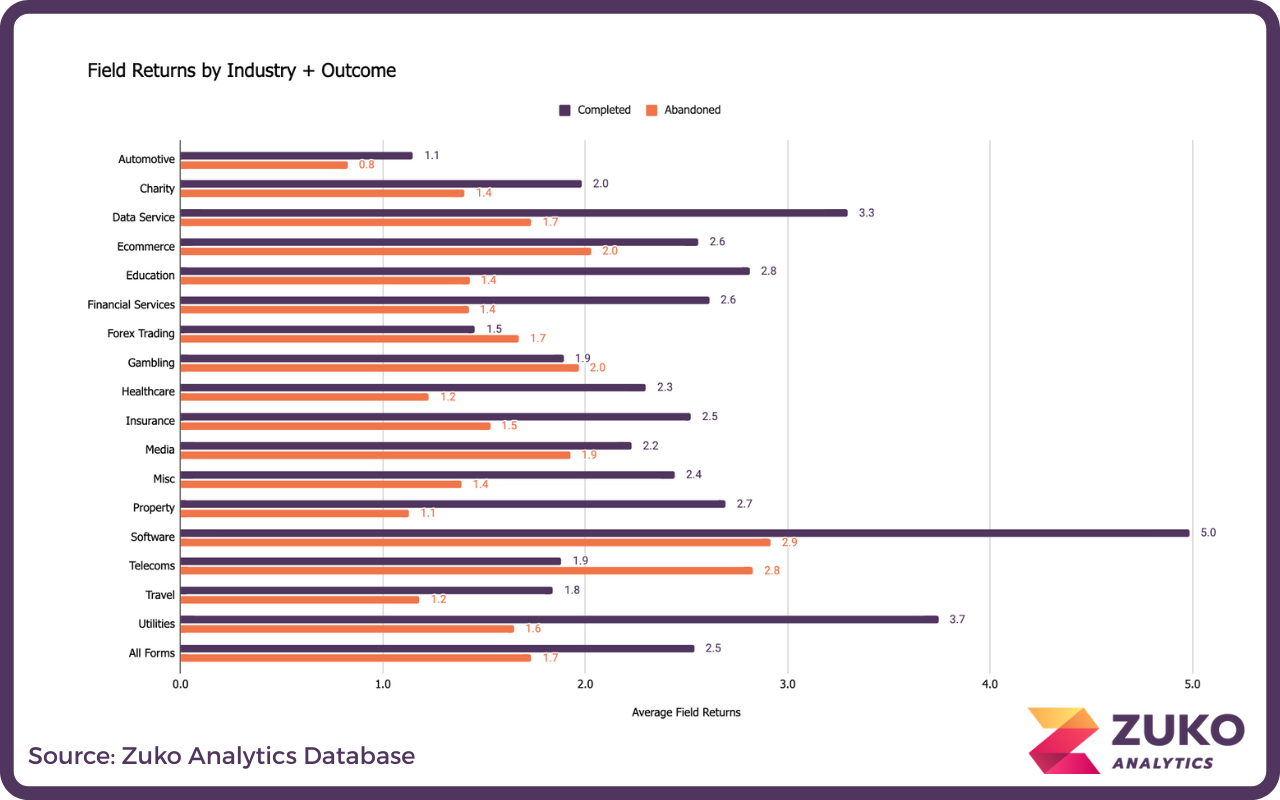
The average number of field returns by industry:

Bar chart showing average field returns by industry distinguishing between Completed and Abandoned outcomes, with Software having the highest Completed returns at 5.0 and Telecoms the highest Abandoned returns at 2.9.

If you have any questions or would like to learn more about Zuko’s benchmarking data or how Zuko can help you improve the completion rate of your forms please contact us on sales@zuko.io

About the Data

Find out more about the data we've used to go into our benchmarking study. Get a breakdown of industries, form types, browsers and device types. Click to see more.

Partial donut chart showing percentages for Ecommerce (16.5%), Financial Services (15.8%), Insurance (14.2%), and segments for Forex Trading, Gambling, Utilities, Education, Software, and others, color-coded with a legend on dark background.

Form Type Benchmarking

Compare the performance of different types of form, such as application, purchase, registration across a range of Zuko metrics. Click to see more on different form types.

Scatter plot showing median completion time with data points clustered mostly below 200 seconds and a trend line with a slight positive slope.

Form Performance Analysis

Explore how different form performance metrics affect each other - for example compare the number of form fields with the average number of field returns. Click to find out more.

Scatter plot with large yellow-green bubbles on a dark gray background, showing data points clustered around 50%, 60%, 70%, and 80% on the horizontal axis labeled with 'Total: S-C' at 50%.

Key Conversion Rate Statistics - More Information

If you are a journalist or writer wanting to know more about our form abandonment statistics, or if you simply have any questions or feedback on our data, feel free to get in touch using the short form below:

Thank you! Your submission has been received!
Oops! Something went wrong while submitting the form.