Form Statistics Correlation

In this section of our benchmarking we plot two key metrics against each other to see if there is any direct relationship between them.

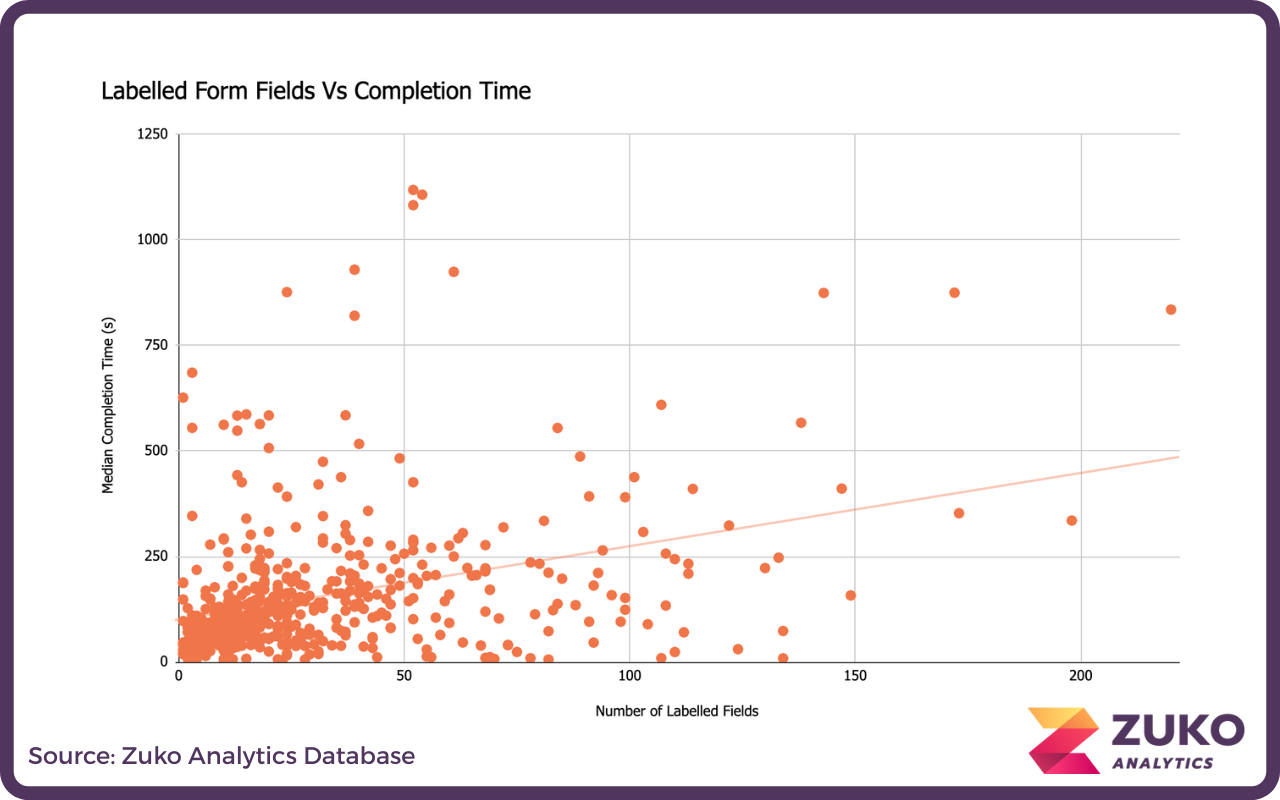
Firstly, we compare the number of fields on a form with the number of questions asked. As you might expect, the more fields on a form, the longer it takes to complete.

Scatter plot showing median form completion time in seconds versus number of labelled fields, indicating a slight upward trend as labelled fields increase.

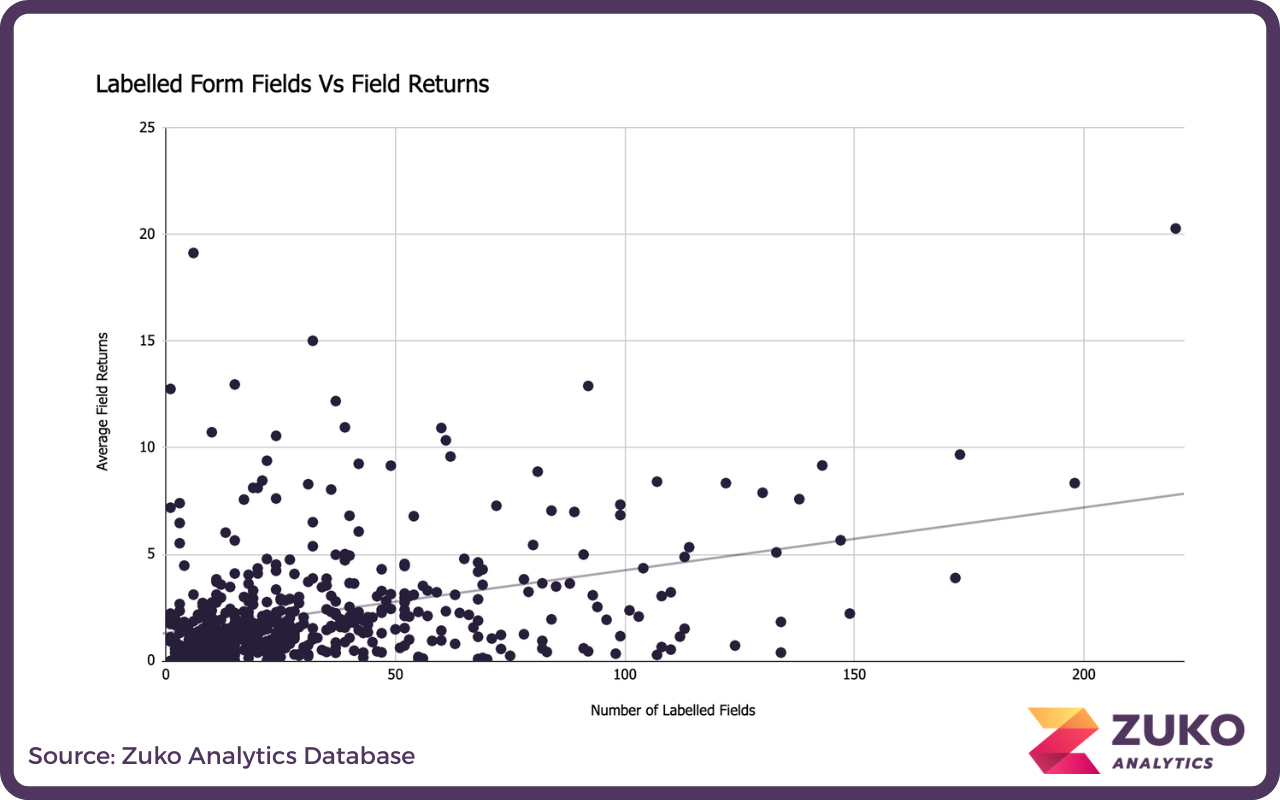
Similarly, the more questions, the more field returns a form is likely to have.

Scatter plot showing relationship between number of labelled form fields and average field returns, with a slight positive trend line.

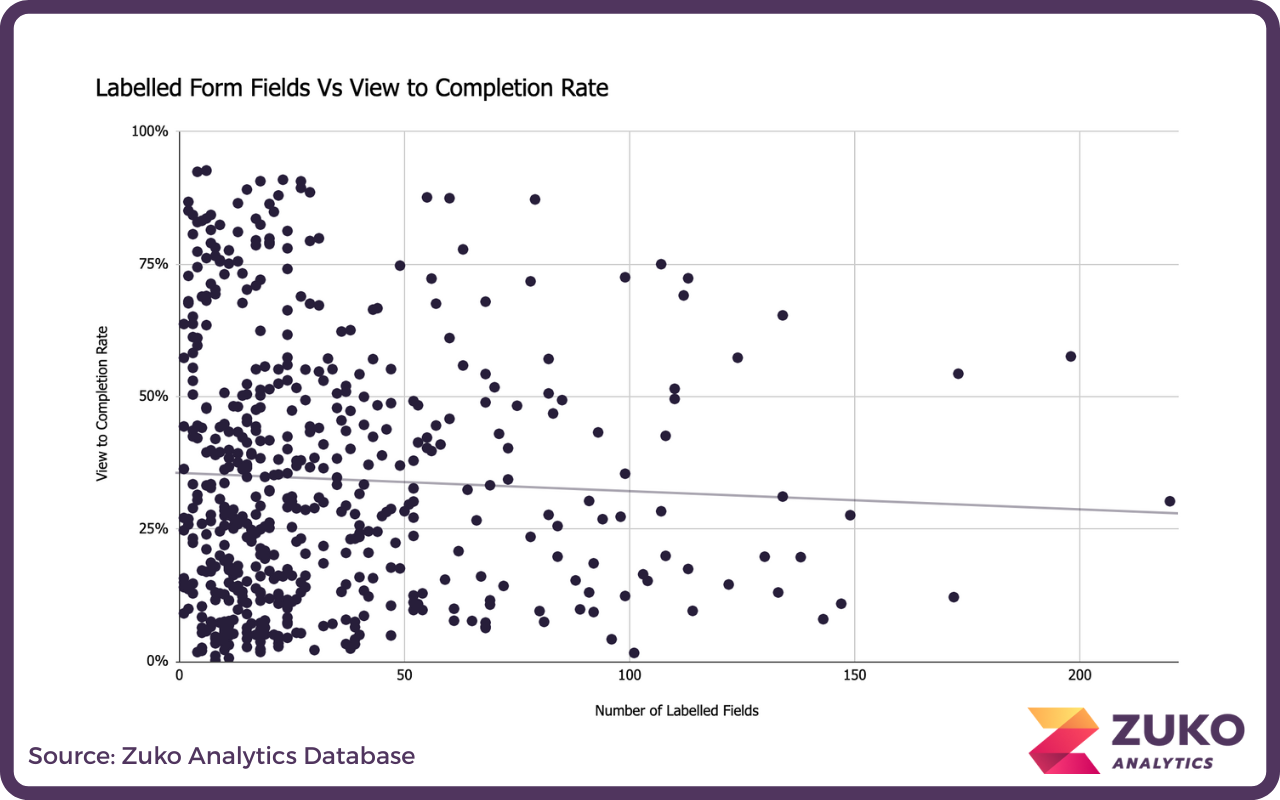
Interestingly, there seems to be a negative relationship between the number of questions asked and the completion rate.

Scatter plot showing a negative correlation between number of labelled form fields and view to completion rate, with data points concentrated below 50 fields and varying completion rates from 0% to 100%.

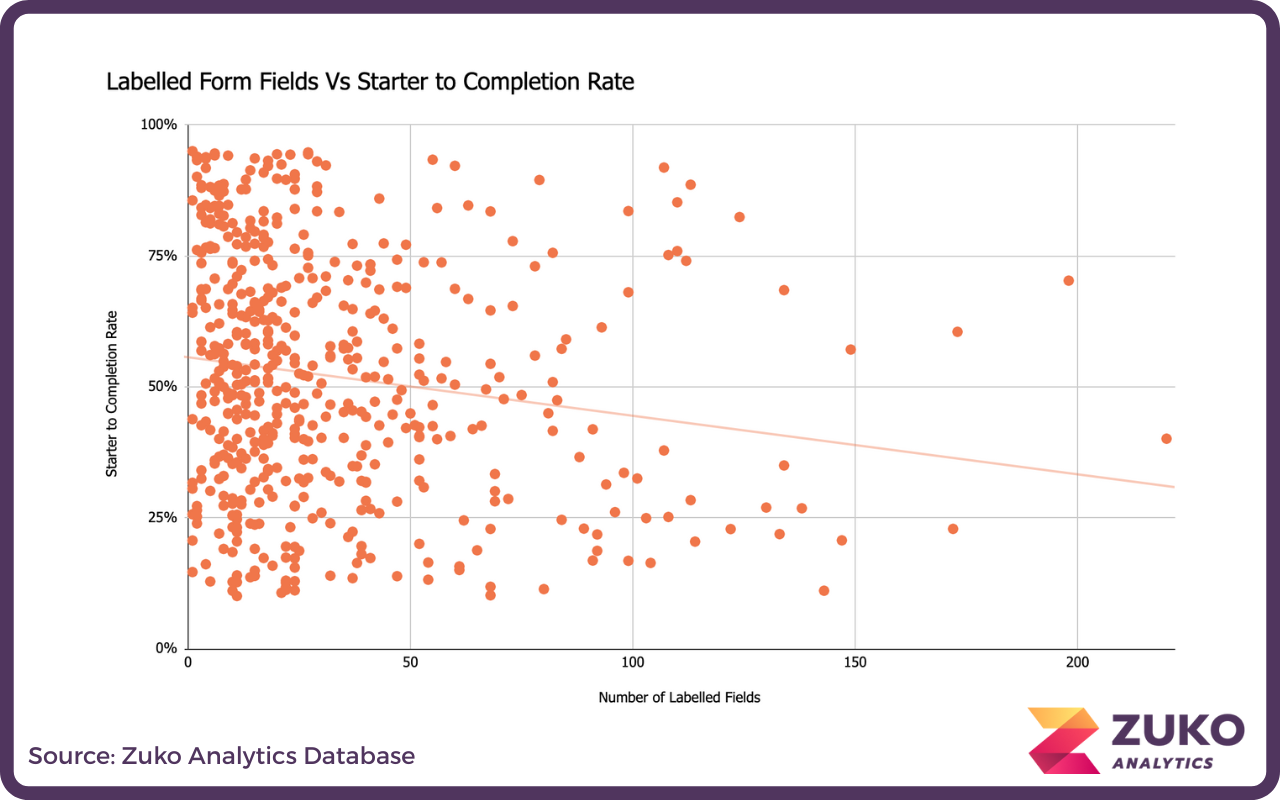
The negative trend is even more marked when we look at the Starter to Completion rate. The more questions, the lower average completion rate.

Scatter plot showing a slight negative trend between number of labelled form fields and starter to completion rate, with higher completion rates clustered near fewer labelled fields.

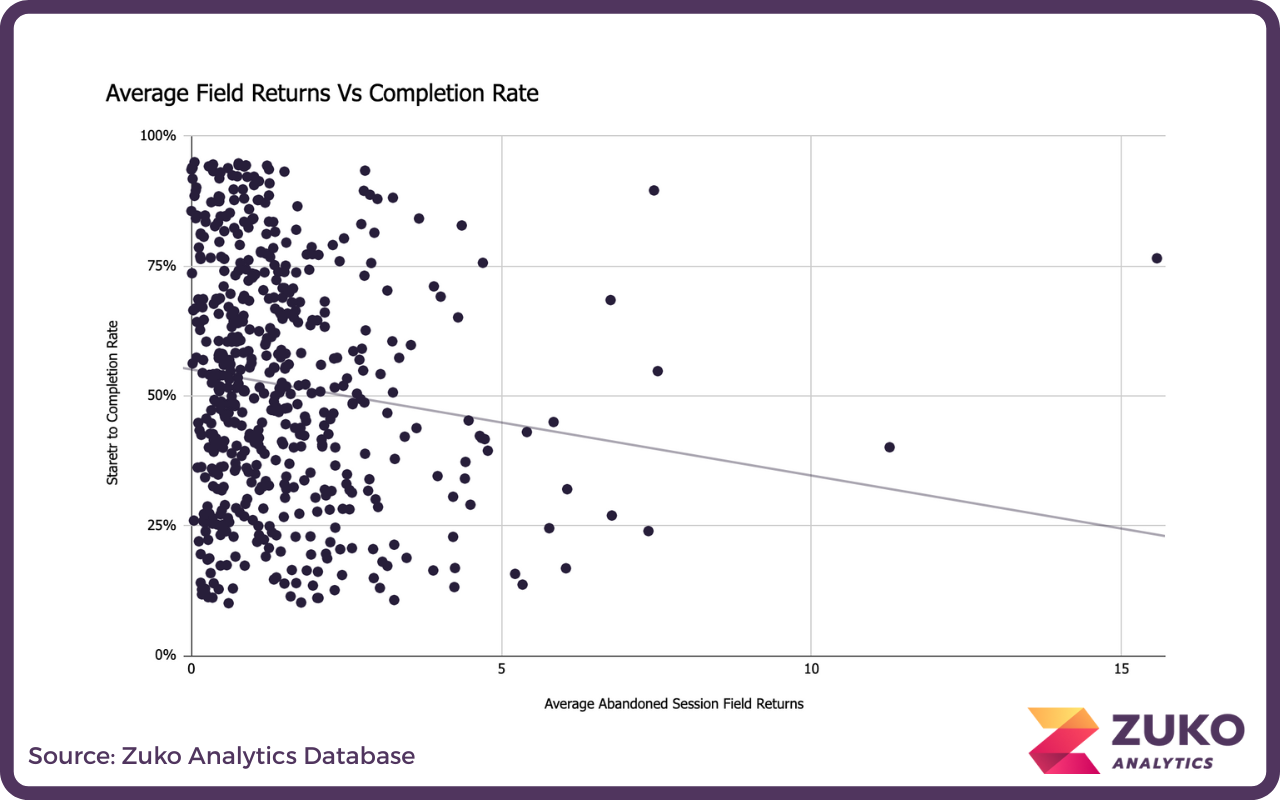
We’ve always used field returns as a proxy for user frustration (having to jump back and forth between fields to make corrections is annoying). This graph makes it clear that this is ultimately related to more form abandonment. The more field returns, the lower the completion rate.

Scatter plot showing average abandoned session field returns versus starter to completion rate, with a slight downward trend line, sourced from Zuko Analytics Database.

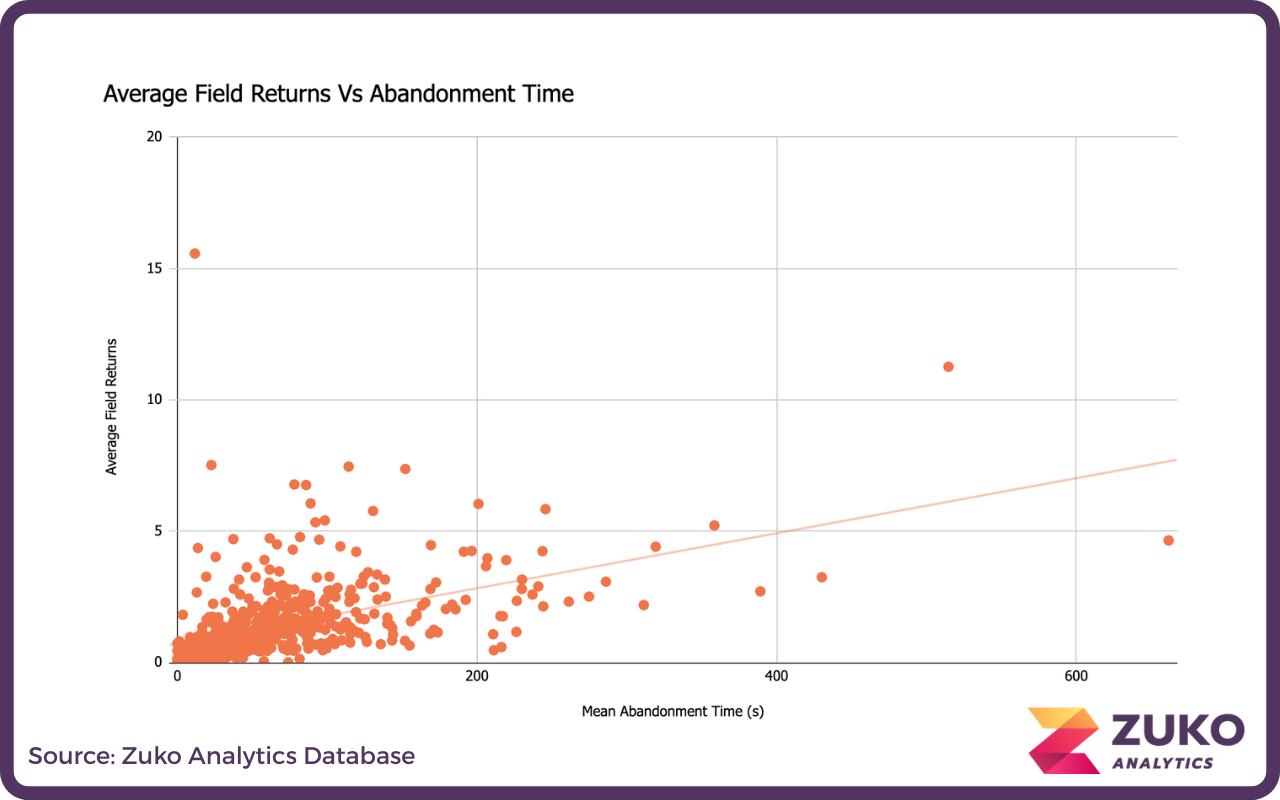
The more field returns the longer people suspend on the form (abandoned sessions).

Scatter plot showing average field returns versus mean abandonment time in seconds with a trend line and clustered data points mostly below 200 seconds abandonment time.

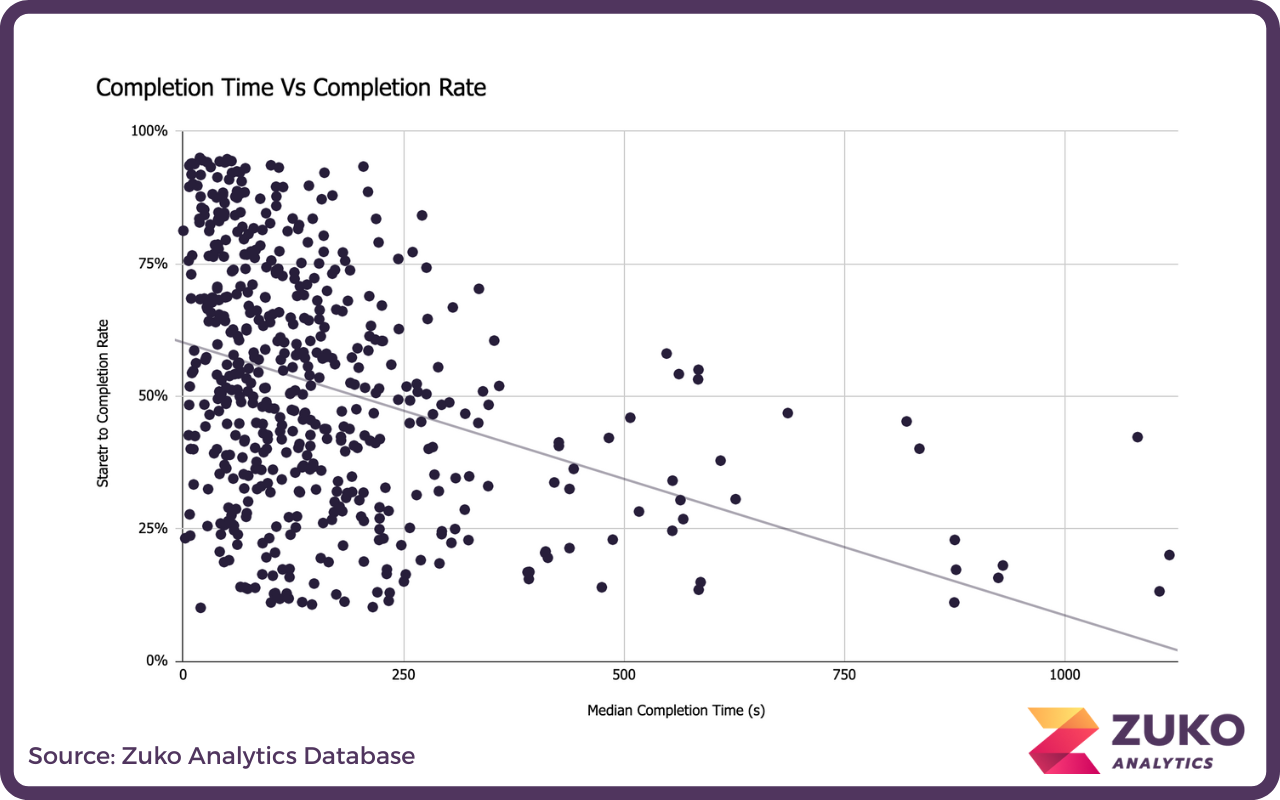
The time it takes to complete a form and completion rate are negatively correlated (perhaps as both are related to the number of questions asked).

Scatter plot showing a negative trend between median completion time in seconds and start to completion rate percentage with data points clustered between 0 and 250 seconds and 0 to 100% completion rate.

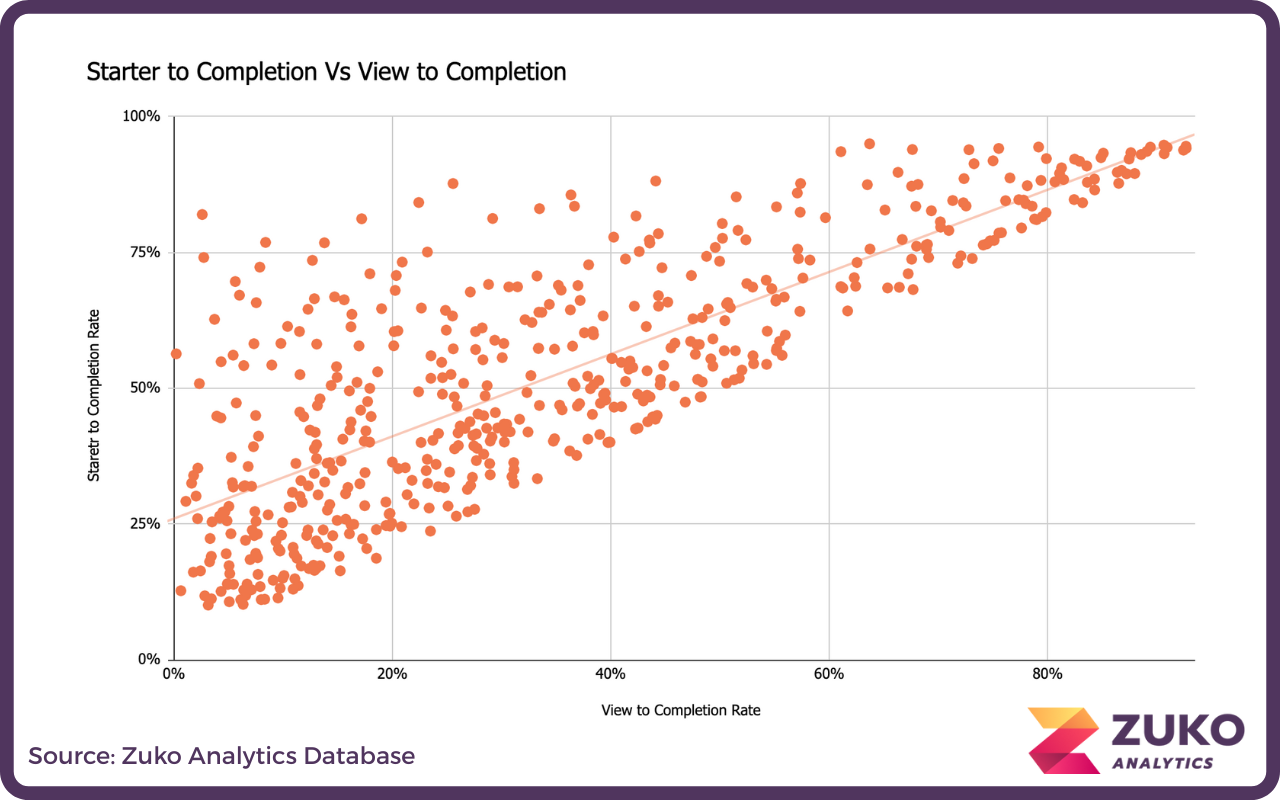
Finally, and unsurprisingly, Starter to Completion and View to Completion have a significant positive relationship.

Scatter plot showing correlation between view to completion rate and start to completion rate with orange dots and a trend line, sourced from Zuko Analytics Database.

If you have any questions or would like to learn more about Zuko’s benchmarking data or how Zuko can help you improve the completion rate of your forms please contact us on sales@zuko.io
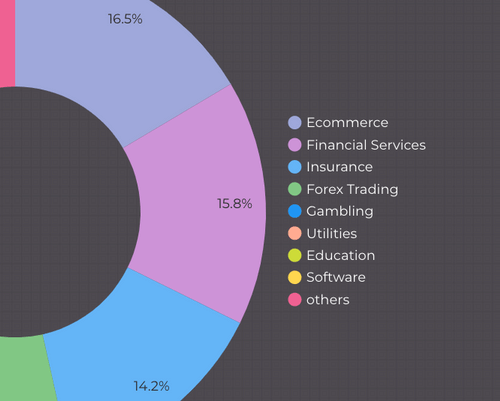
About the Data

Find out more about the data we've used to go into our benchmarking study. Get a breakdown of industries, form types, browsers and device types. Click to see more.

Partial donut chart showing percentages for Ecommerce (16.5%), Financial Services (15.8%), Insurance (14.2%), and segments for Forex Trading, Gambling, Utilities, Education, Software, and others, color-coded with a legend on dark background.

Industry Benchmarking

Compare industry form performance across a wide range of form metrics, including average form completion rate, time to complete, and more. Click to start exploring the data.

Horizontal bar chart with multiple colored bars on a dark grid background representing comparative data.

Form Type Benchmarking

Compare the performance of different types of form, such as application, purchase, registration across a range of Zuko metrics. Click to see more on different form types.

Scatter plot showing median completion time with data points clustered mostly below 200 seconds and a trend line with a slight positive slope.

Got any questions or feedback on our data?

Please get in touch using the short form below:

Thank you! Your submission has been received!
Oops! Something went wrong while submitting the form.