
About our form analytics data
Here we provide a bit of information on the data we’ve used for our benchmarking. You can view how the data splits by form purpose, industry, device, browser and customer type.
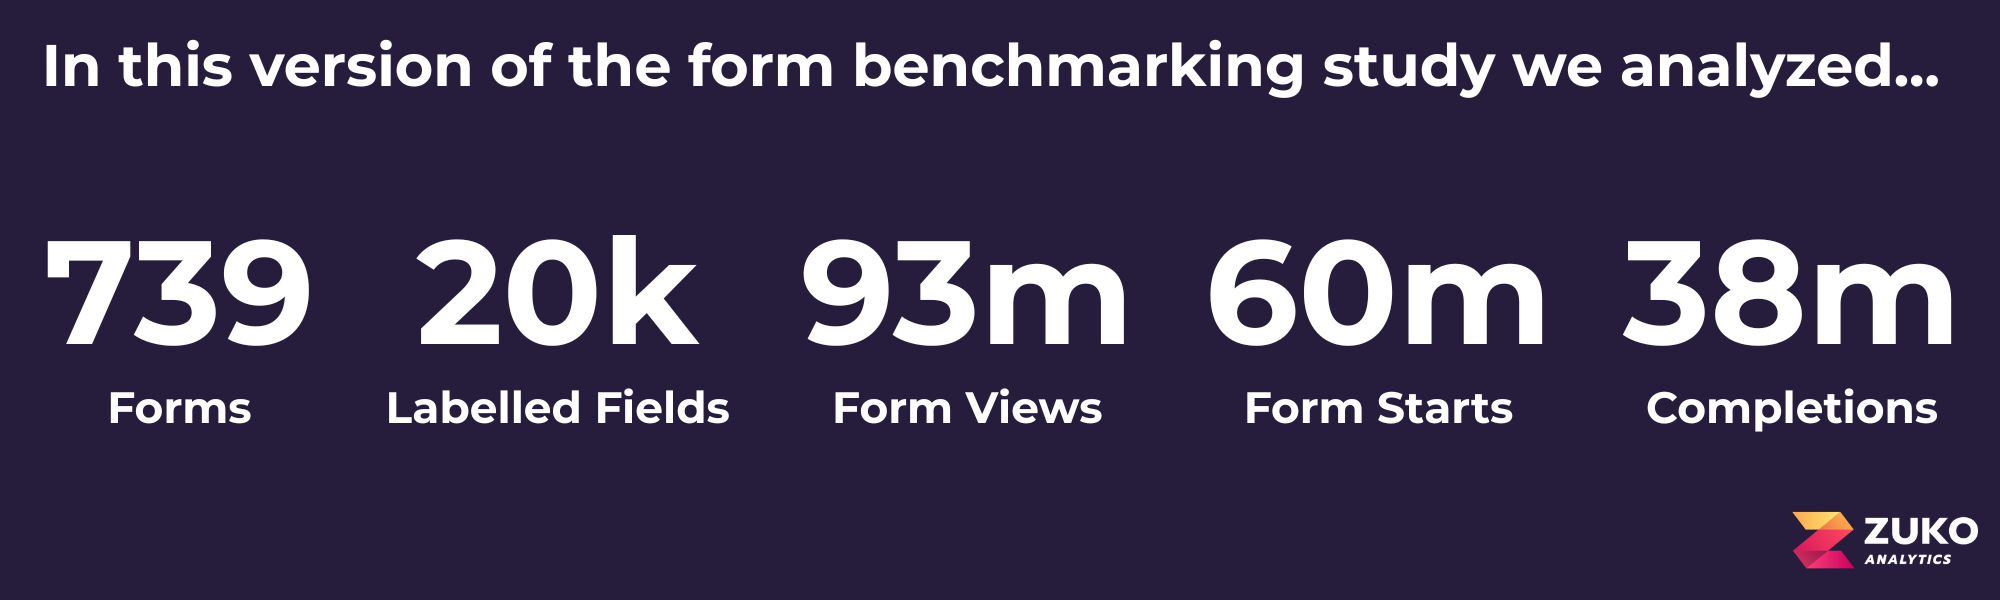
Overall Summary
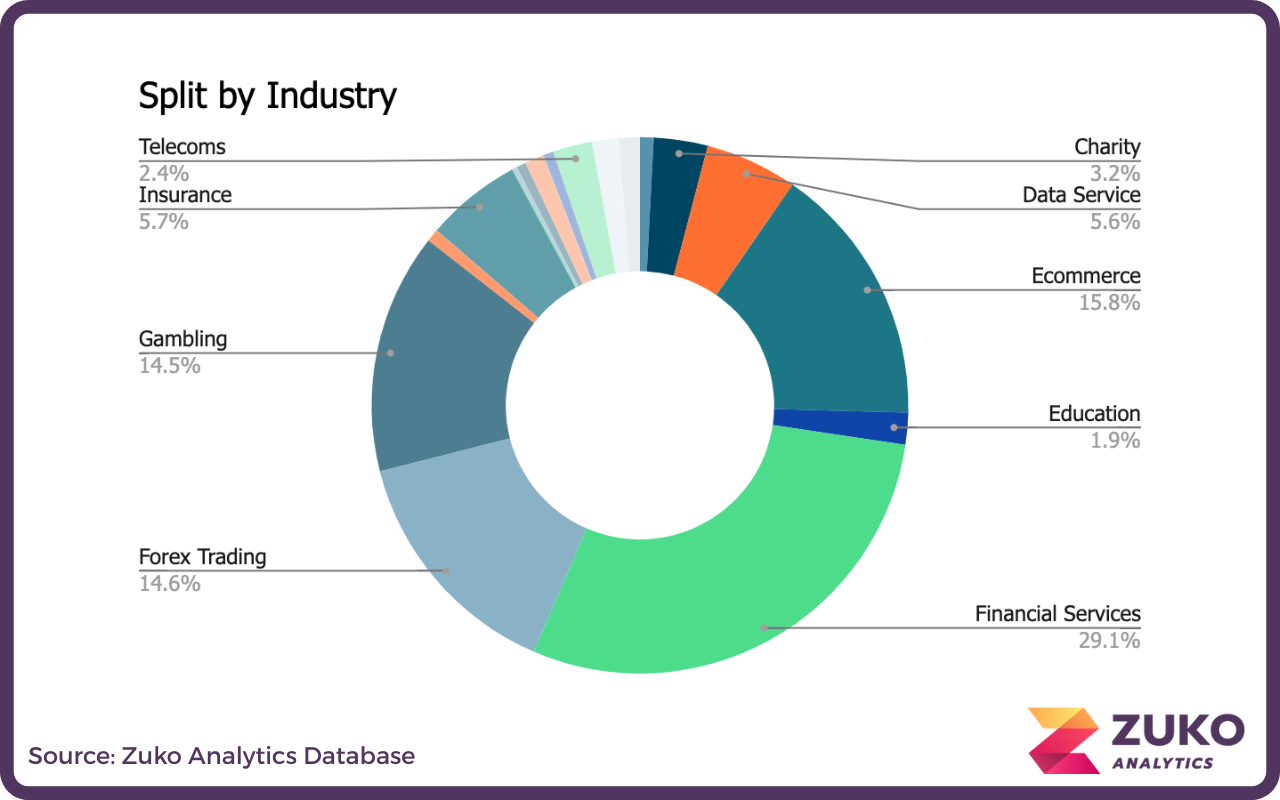
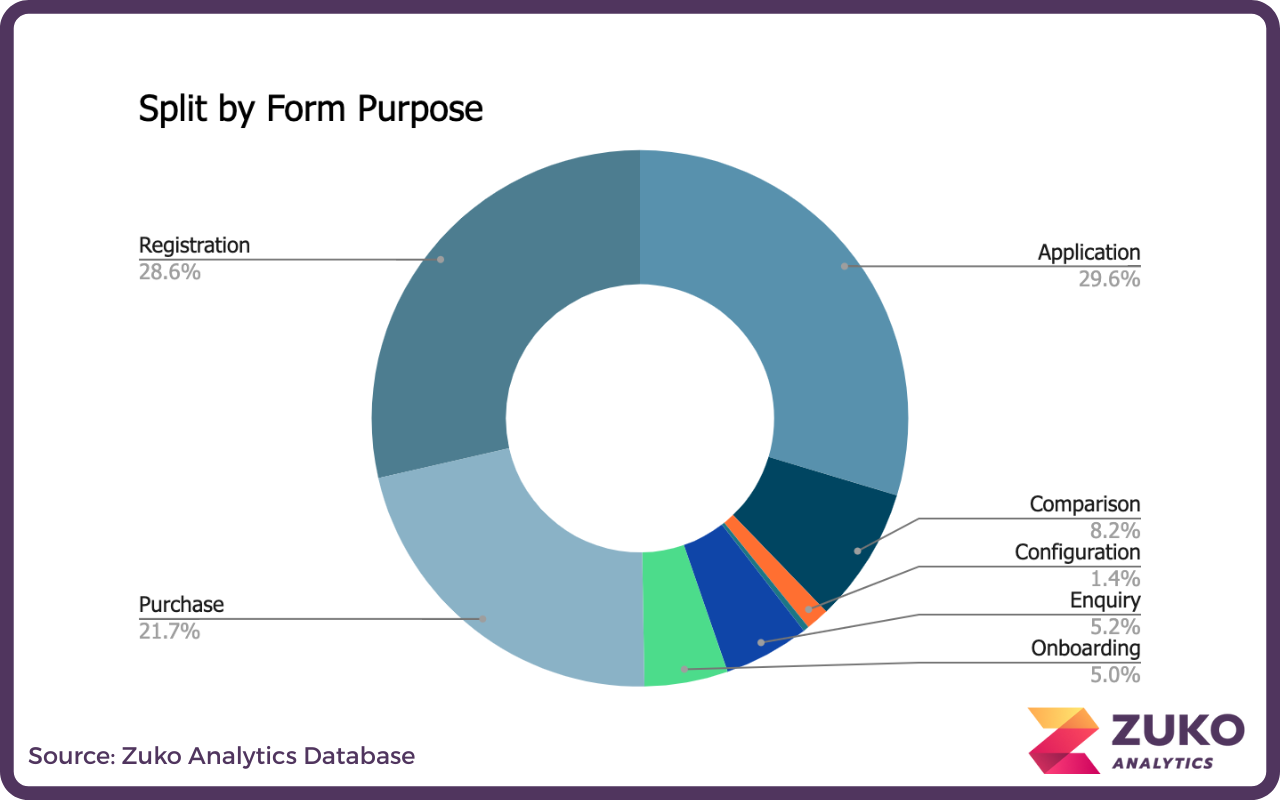
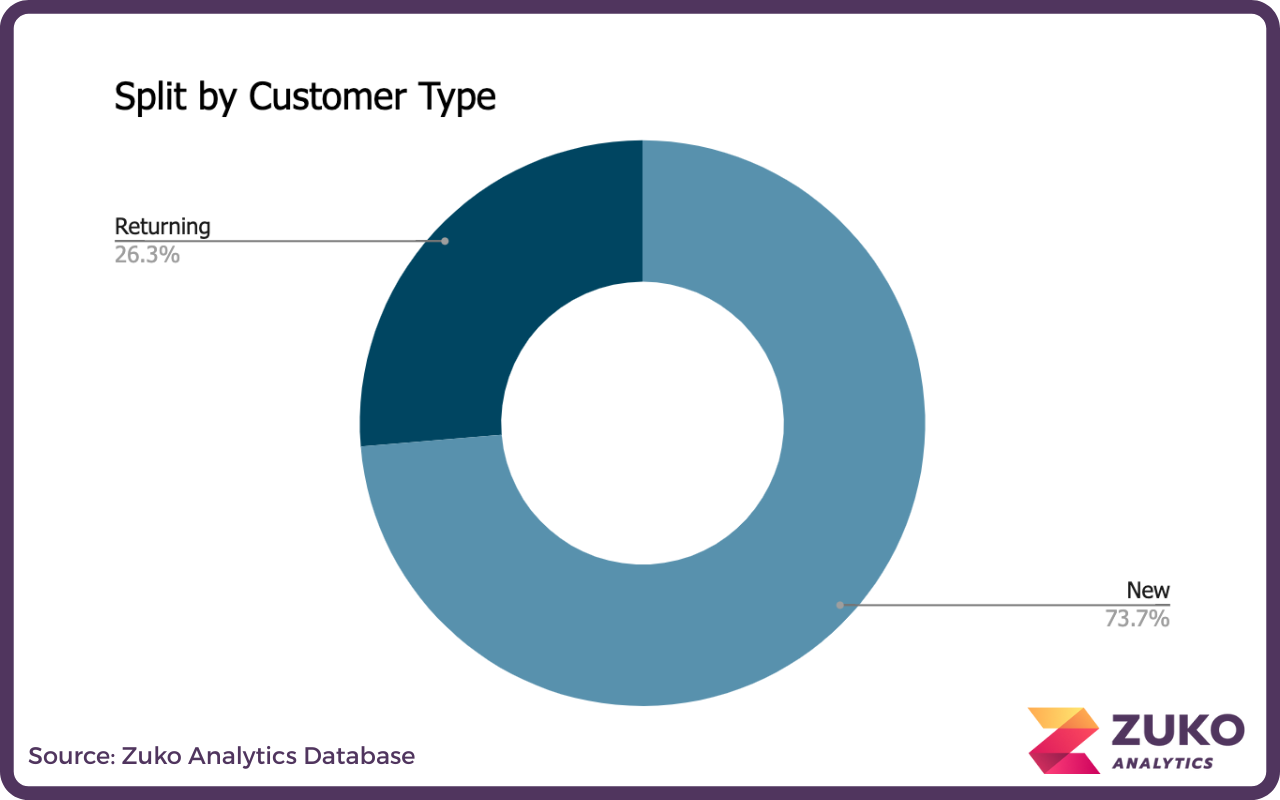
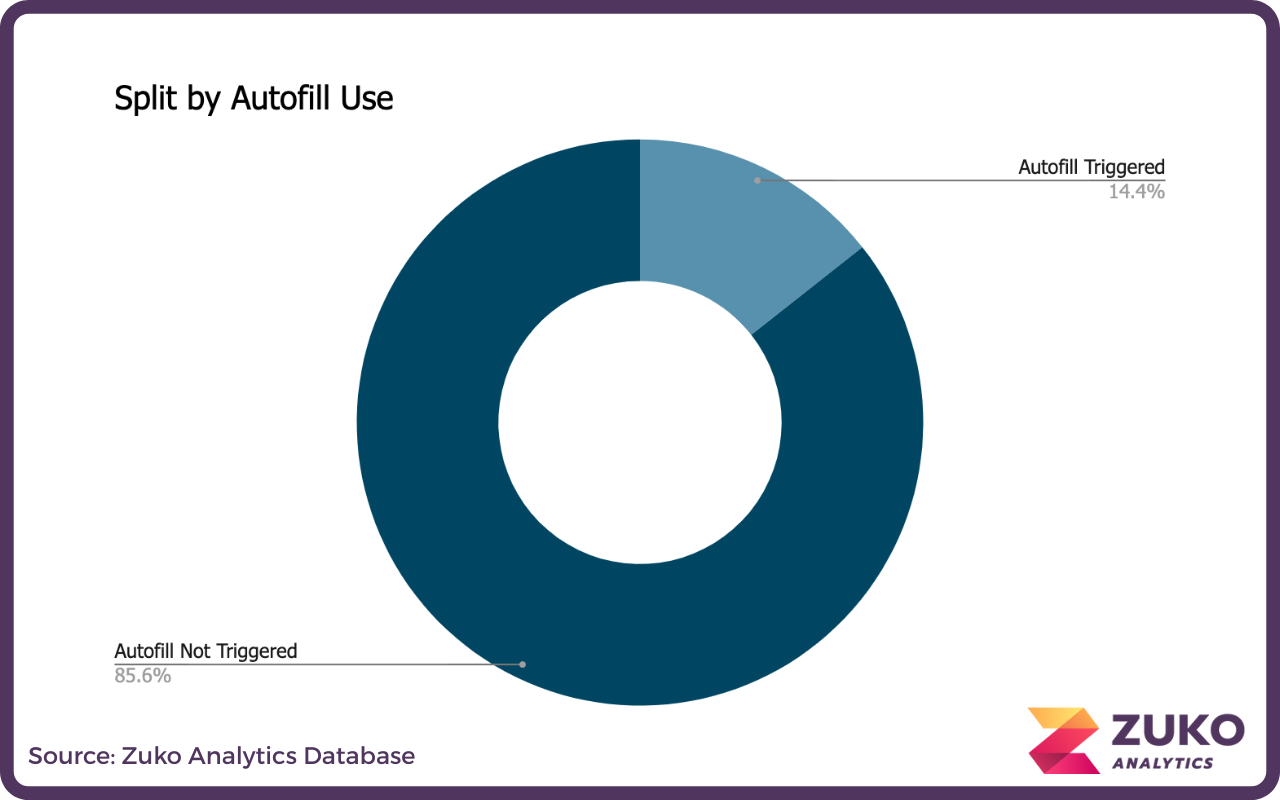
Sessions Splits
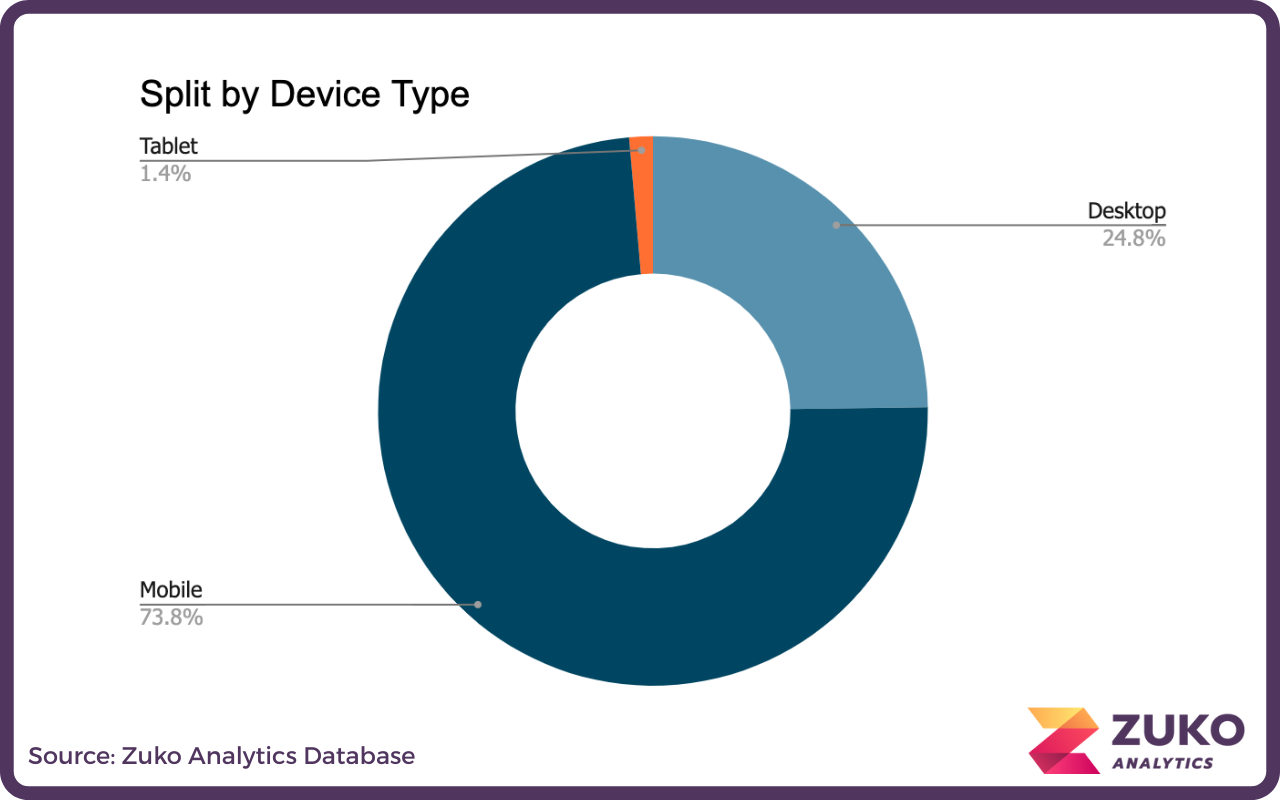
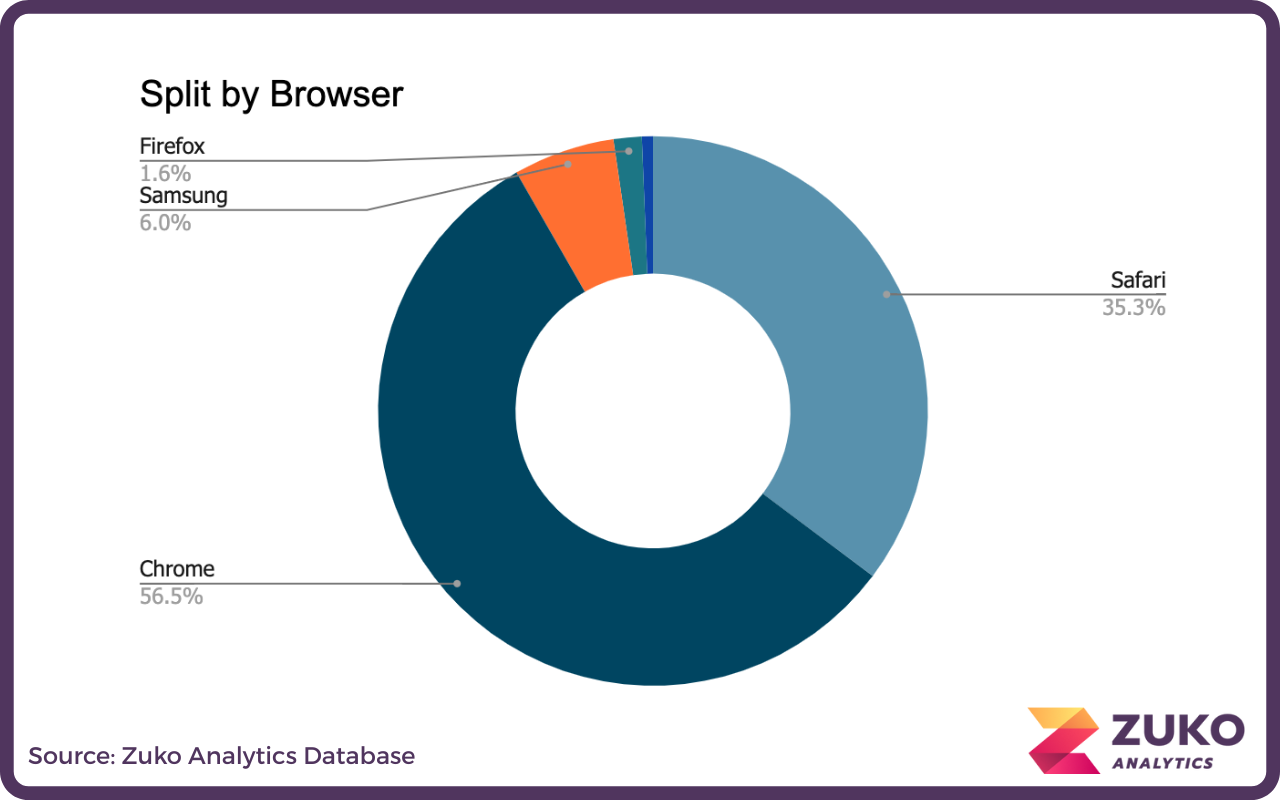
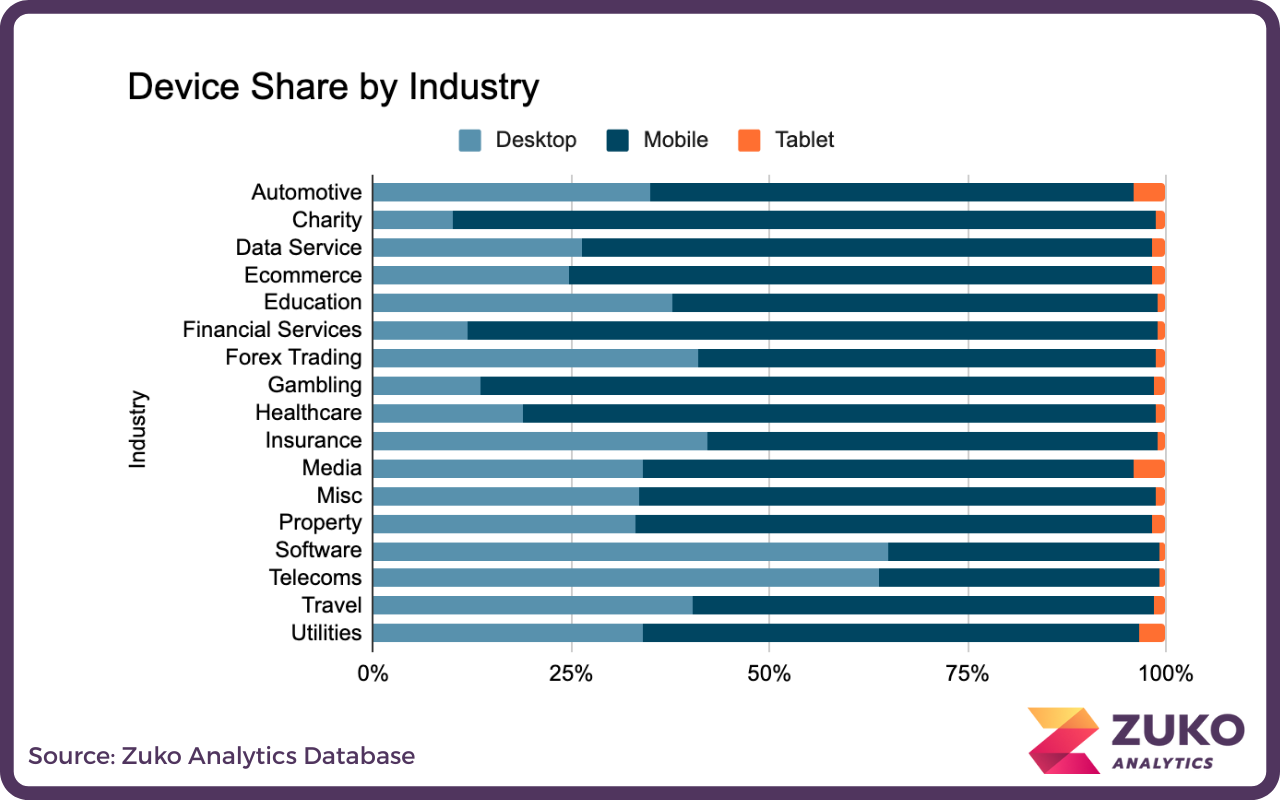
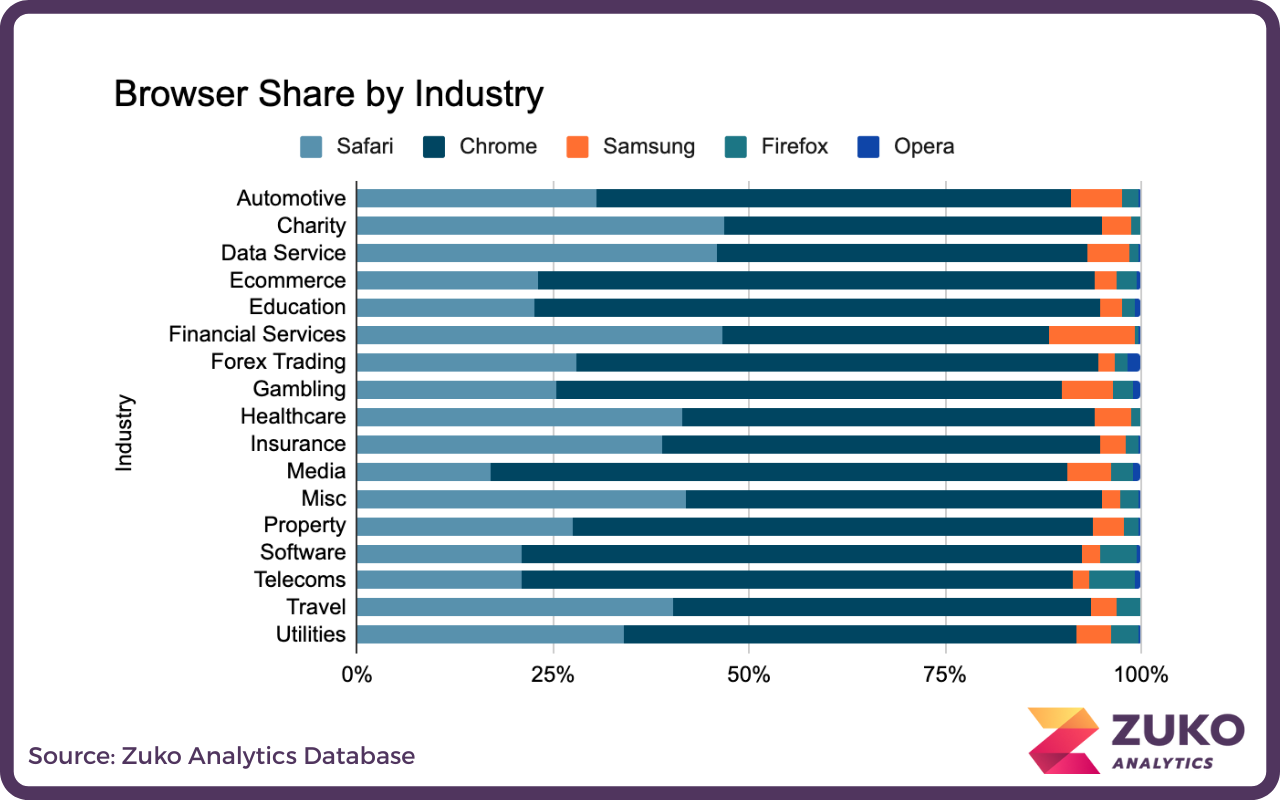
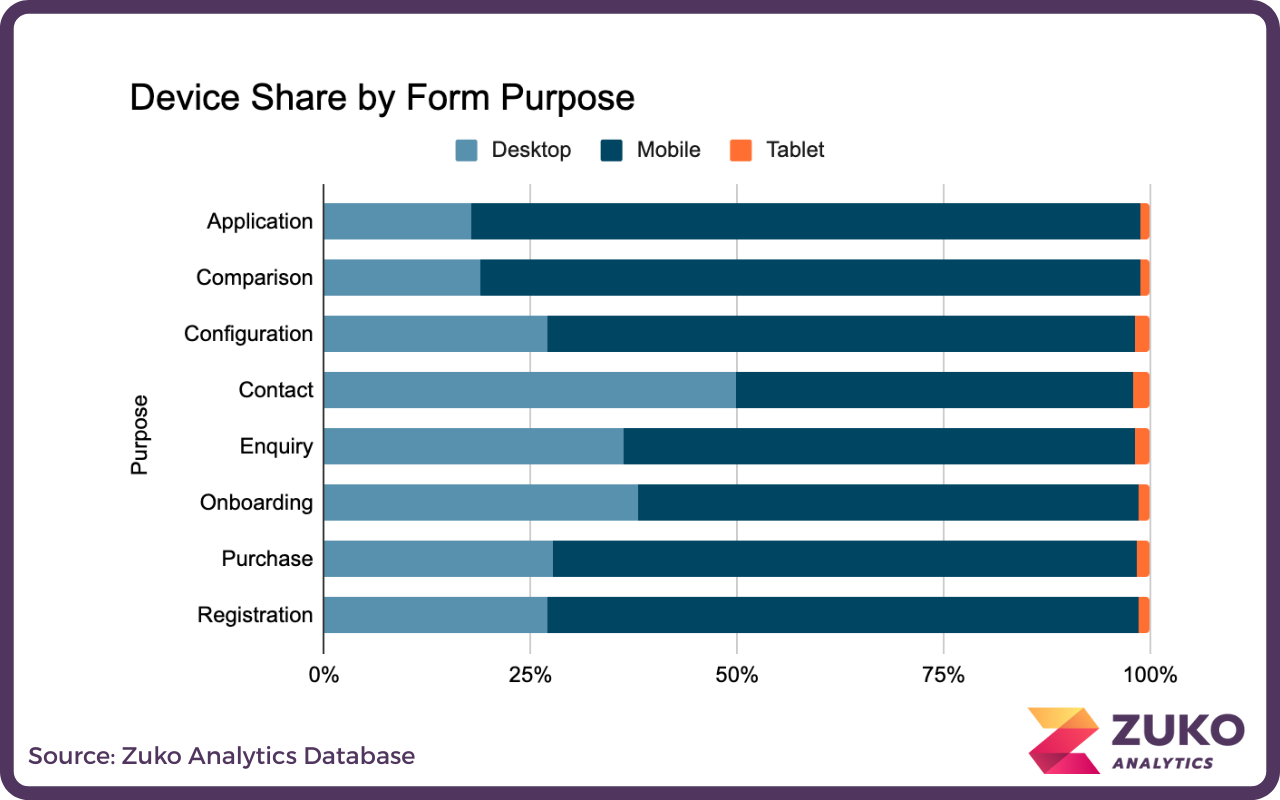
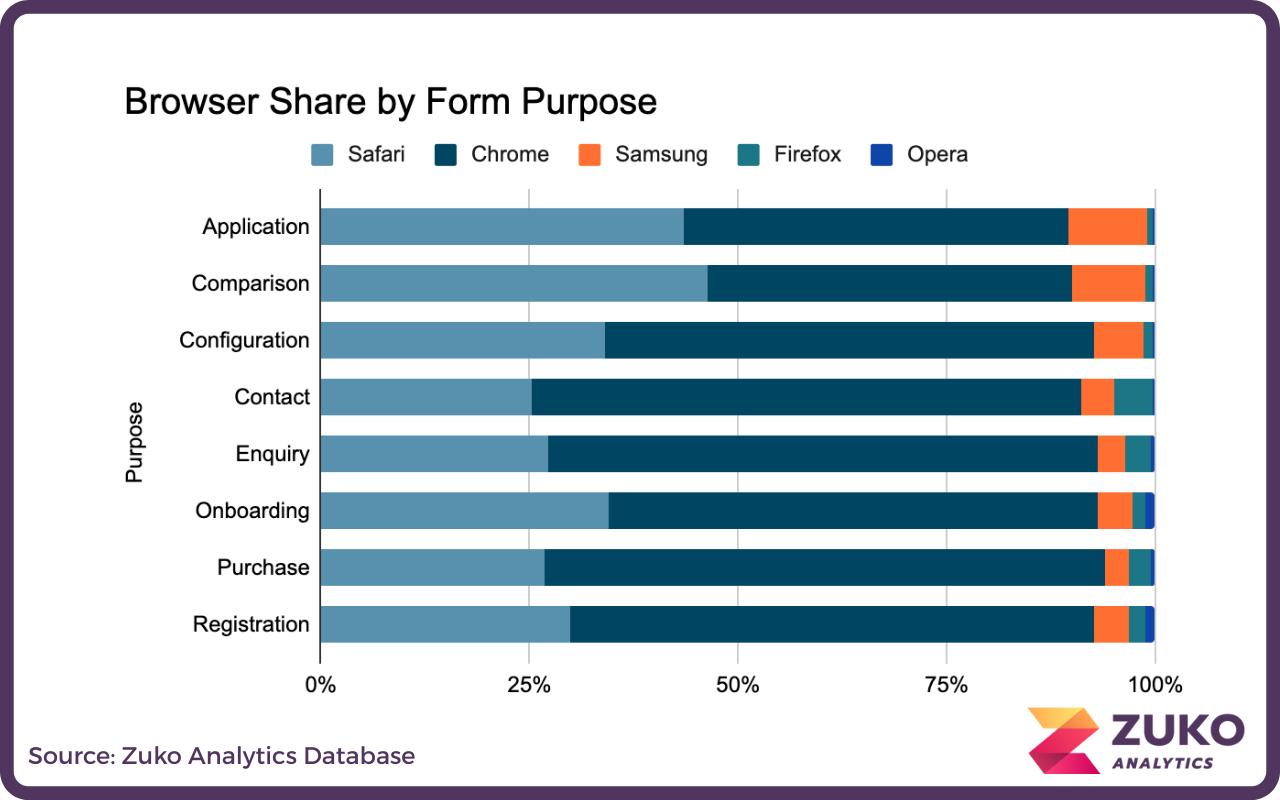
Browser & Device Splits
If you have any questions or would like to learn more about Zuko’s benchmarking data or how Zuko can help you improve the completion rate of your forms please contact us on sales@zuko.io
Industry Benchmarking
Compare industry form performance across a wide range of form metrics, including average form completion rate, time to complete, and more. Click to start exploring the data.

Form Type Benchmarking
Compare the performance of different types of form, such as application, purchase, registration across a range of Zuko metrics. Click to see more on different form types.

Form Performance Analysis
Explore how different form performance metrics affect each other - for example compare the number of form fields with the average number of field returns. Click to find out more.
Got any questions or feedback on our form analytics data?
Please get in touch using the short form below: