
Interpreting Your Data - The Basics
Getting data into your account is only the first step in your journey with Zuko. The next most important thing to learn is how to look at your data, interpret it and gain insight into what your visitors are doing in your online forms.
Though we can’t make you into a form design expert overnight, the following are some tips to help you use the data in your account.
Have your form open whilst looking at the data

All data requires interpretation, and one of the best ways to help you interpret the data in your account is to have the form you are investigating open, either next to your Zuko data or at the very least open in a different tab.
This allows you to quickly switch between a metric and the relevant part of your form. Overview stats should lead to you examine the layout of your form. Field level data should always lead you to examine the field in question in great detail.
Don’t look at the data in isolation, tie it to the real thing that visitors to your site are interacting with.
Look at field data in context
Fields and elements of your form do not exist in isolation. They form part of a flow, or a journey for your visitors. So when looking at the metrics for a particular field, remember that this behaviour may be influenced by the fields around it as well at the text, imagery, error messaging and labels around it.
For example, abandons after clicking submit do not necessarily mean that there’s a problem with your submit button, instead this indicates that a visitor was inputting data, tried to submit the form and chose not to do anything else. It is therefore useful to use the Session Explorer to find out what visitors were doing before they clicked submit.
Another example - a field abandon may not mean that the field itself has any major issues, it may mean that it was the point that a visitor reached frustration and chose to leave. It may also be an indication that the next field in the form was not one they were willing to try to complete, and chose to leave the form instead.
Use segments and filters to find issues
Forms are not static images on a page. They are interactive interfaces built with code, and as such can behave differently for people that have a different device, browser or have arrived at your form from different paths.
Sometimes a visitor experience may be extremely poor for someone with a combination of these - for example a field may not function correctly for someone on Samsung Internet on a Mobile device. However you may not immediately see this stand out in your data as this segment of visitors represents a small proportion of your overall traffic.
It is therefore vital that you view key metrics across different combinations of visitors in your form to spot segments that might be underperforming.
The Segment Comparison view is a great place to do this, by creating multiple comparisons that compare different groups against each other across key metrics.
For example you might want to view how different devices perform:
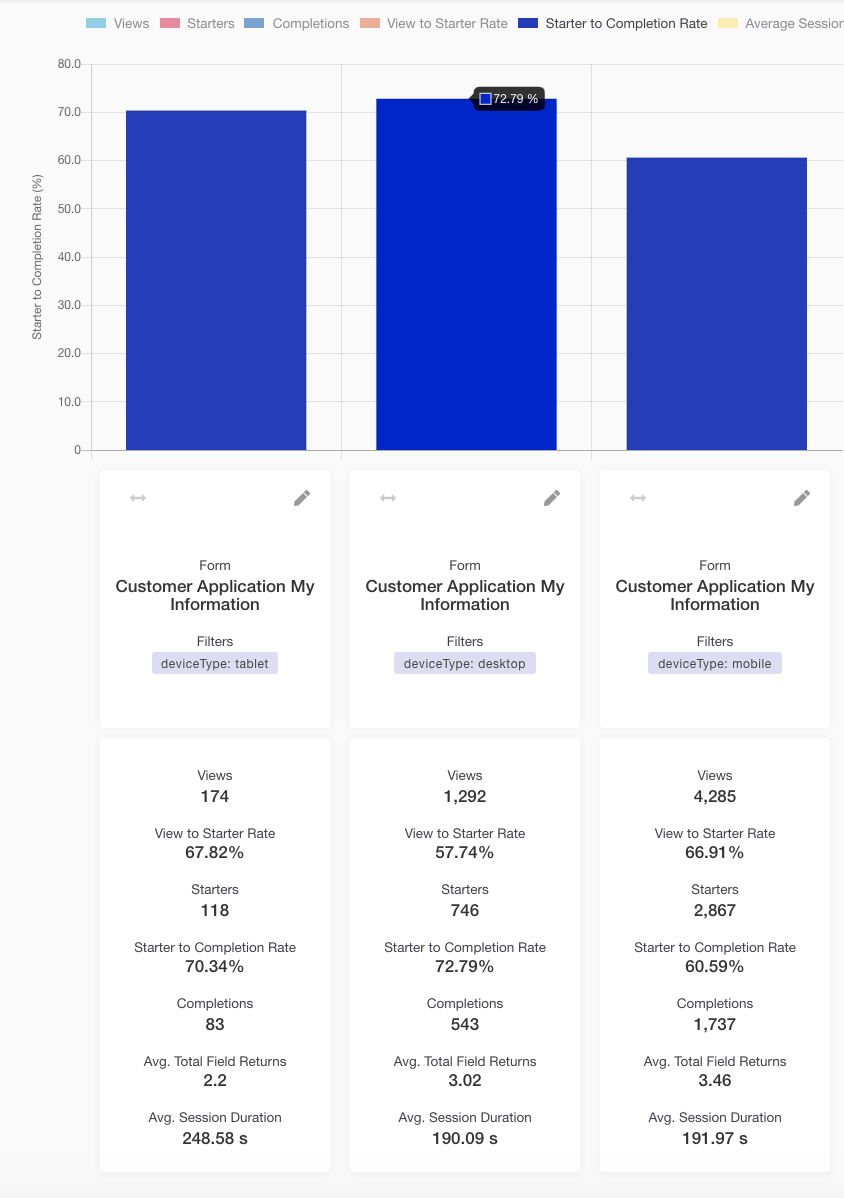
Here we can clearly see that mobile traffic completes the form at a lower rate than other devices.
You can also compare browsers against each other, or combinations of these two, or any custom attributes you have set up which might include traffic course, new vs returning, basket size, A/B test version.
You can then choose to explore all of your other metrics looking at this segment of visitors to find insights.
Go from the broad to the narrow and deep
One of the most powerful benefits of Zuko is that you can go from broad level insights that look across all of your visitors, and then drill down to a small selection of visitor sessions to be able to understand exactly what happened during their experience on your form.
For example you might start by looking at a Segment Comparison at just devices:
From here, noticing that mobile traffic has the poorest completion rate, you could then explore how different browsers performed on mobile devices:

From here you could then use Field Data View to find particular field level issues with that device/browser combination of filters:

After finding issues with a particular field you can then explore sessions that interact with this problem field in the Session Explorer:

The field you’ve searched for will always be highlighted, allowing you to quickly spot any patterns of user behaviour around that field that seem problematic, and fixable.
A typical visitor flow may therefore look like this:
Segment Comparison > Form Data > Field Data > Session Explorer
This can be repeated multiple times for different segments of traffic.
Want to get started with Zuko?
Start a free trial that includes all features, or request a demo