
View, Starter and Completion Rates Over Time Graph
Graphs in the Zuko Form Aggregate view give you top-line data that’s easy to understand so you can quickly get an overall picture of how your forms are performing.
Until recently, View to Starter Rate and Starter to Completion Rate were separate graphs.

We’ve now launched a new graph: Views, Starters and Completion Rates Over Time. This graph replaces both the View to Starter Rate and Starter to Completion graphs and also includes the Completion Rates Over Time metric too.

This new, multi-faceted graph gives you a comprehensive view of your forms overall performance for Views, Starters and Completions over time so you can see not only the relationship between these metrics but also the longer-term impact of any changes you make to your form.
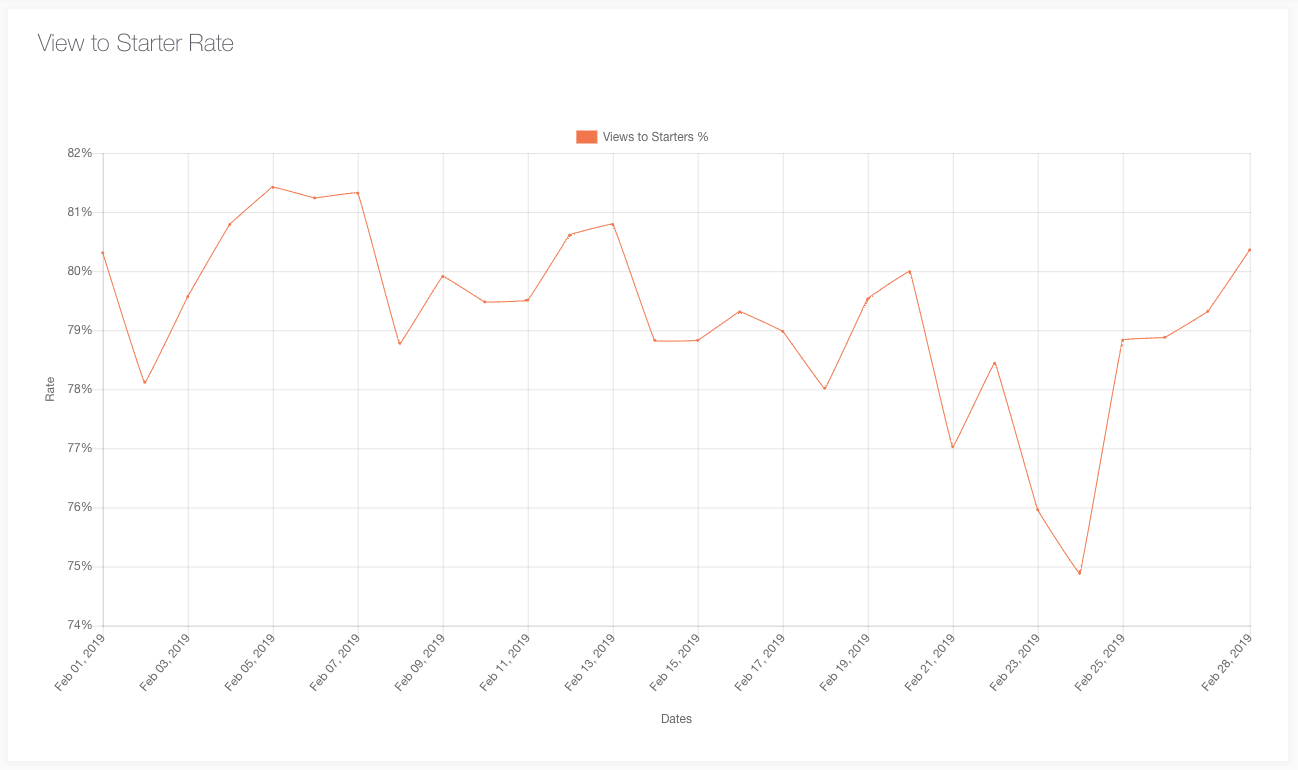
The View to Starter line shows you how many visitors see your form and start interacting with it. Not every visitor who sees your form will go on to start it. You can test small changes and track the improvements in this data point to see what has the greatest impact in encouraging visitors to start your form.
The Starter to Completion line shows how many people who start interacting with your form go on to complete it. See the cumulative impact of changes you make to your form reflected over time by comparing the percentage of visitors who start and go on to complete your form. A low Starter to Completion Rate or reduction in this data point can highlight issues within your form fields or functionality – which you can investigate in the Field Aggregate tab.
Views to Completions shows the percentage of visitors who see your form and go on to complete it. This data point gives you a good indication of your forms overall performance.
Want to get started with Zuko?
Start a free trial that includes all features, or request a demo