
Views, Starters, Completions & Abandons Split By Attribute
This new visualisation (a stacked area graph) helps you understand both movements in metrics over time, but also shows the proportion that different segments contribute to that metric over time.The attribute values are ordered by traffic volume so the biggest volume will appear first in the legend.
A stacked area graph shows the values of multiple groups of data on the same graph with the values displayed on top of each other. The Views, Starters, Completions & Abandons Split By Attribute graph shows how many Views, Starters, Completions or Abandons occur for different attributes e.g. you can compare the number of form starters across device types or the number of abandons by the referral source.
The default selections for the initial visualisation are Abandons by deviceType, but you can easily change these by using the drop downs. If you push custom attributes into Zuko, you can segment your data by these too.
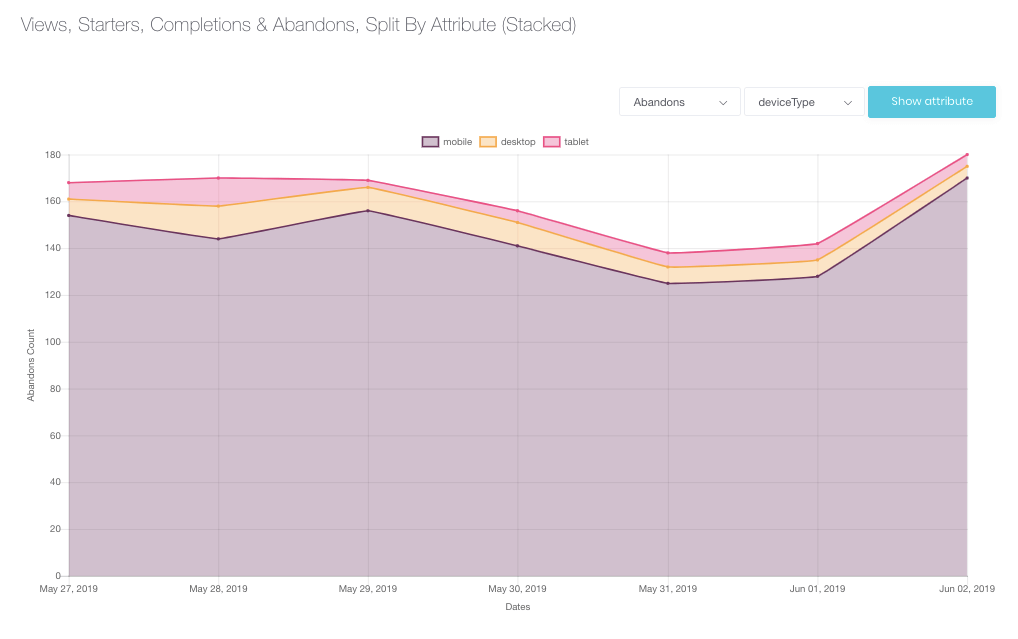
In the graph below we can see Abandons plotted over time for this form, but also see how much each device type contributed to that total. For this form, mobile traffic represents the vast majority of abandons in this form, so perhaps should be a focus for improvement the form.
In the graph below for a different form, we can see that desktop contributed the most completions.

By hovering over the points you can see the numbers in detail.

Want to get started with Zuko?
Start a free trial that includes all features, or request a demo