
Export Zuko Data into Looker Studio (GDS)
Push Zuko data into your Google Data Studio dashboards so all your reporting is in one place
Zuko has its own Looker Studio (Google Data Studios) connector so you can pull Zuko session data into your Looker reports. This guide takes you through how you can do that.
Step 1: Locate API Key
Locate your unique API key in your Profile of the Zuko App.

You will need this to access the connector. If you do not have an API key in your Profile, please contact Zuko support. so that we can enable access.
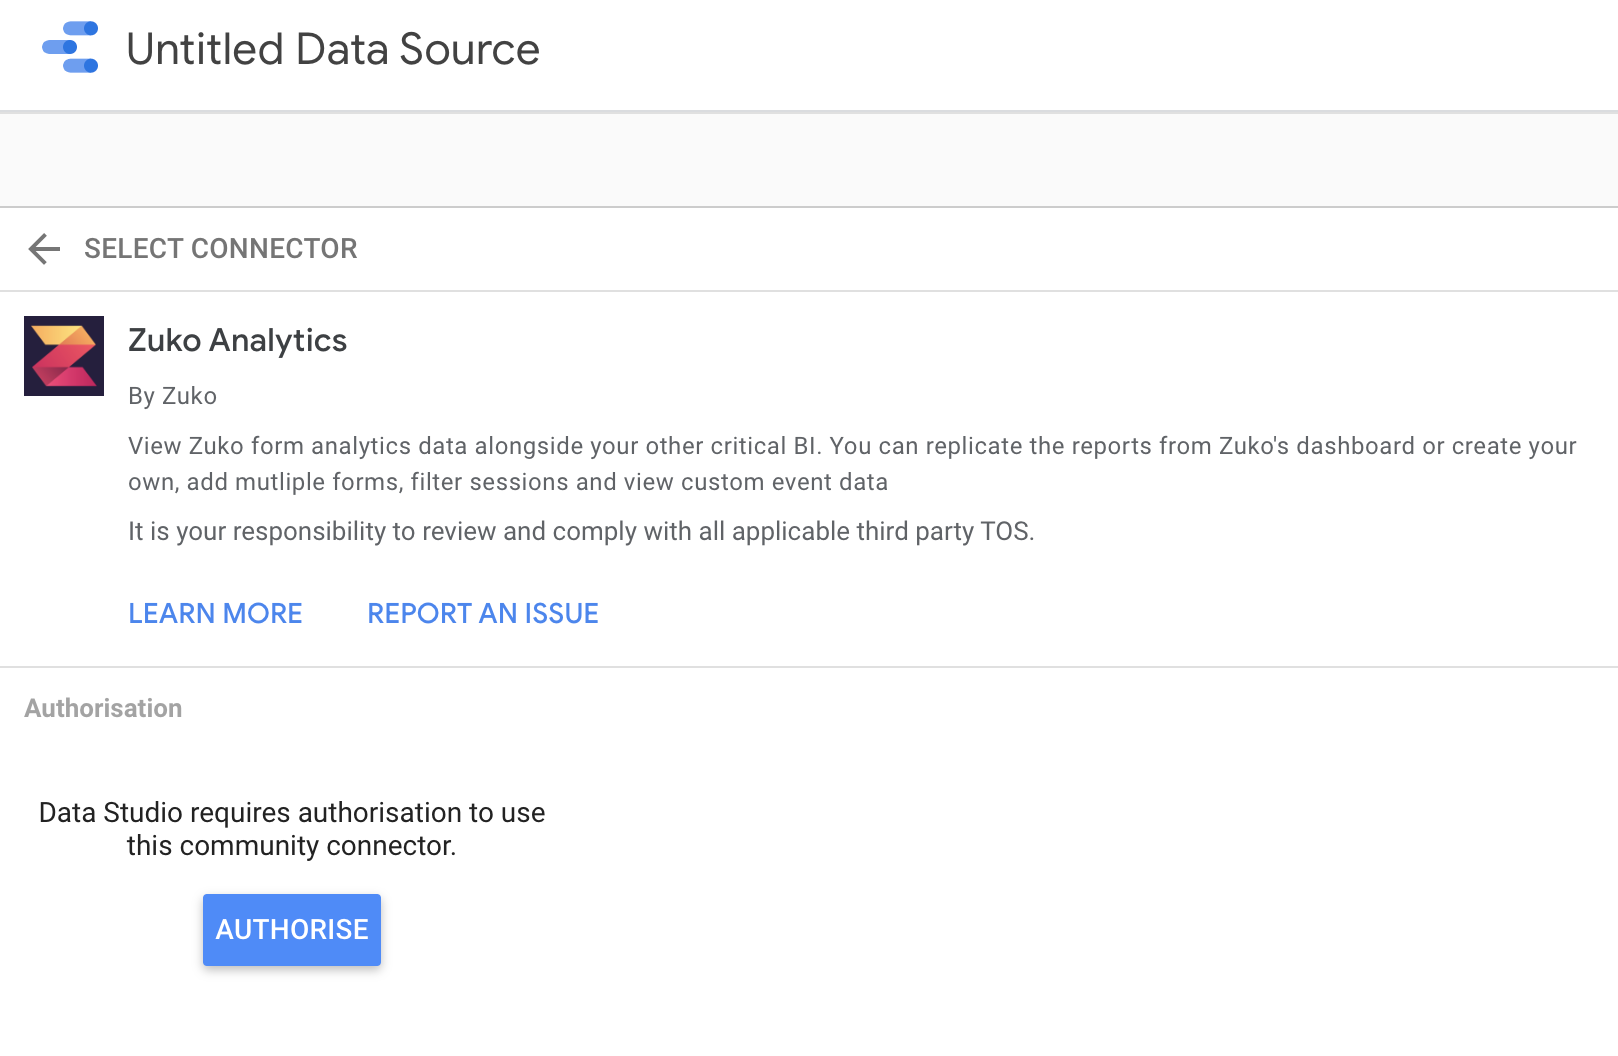
Step 2: Connect to Zuko’s Connector
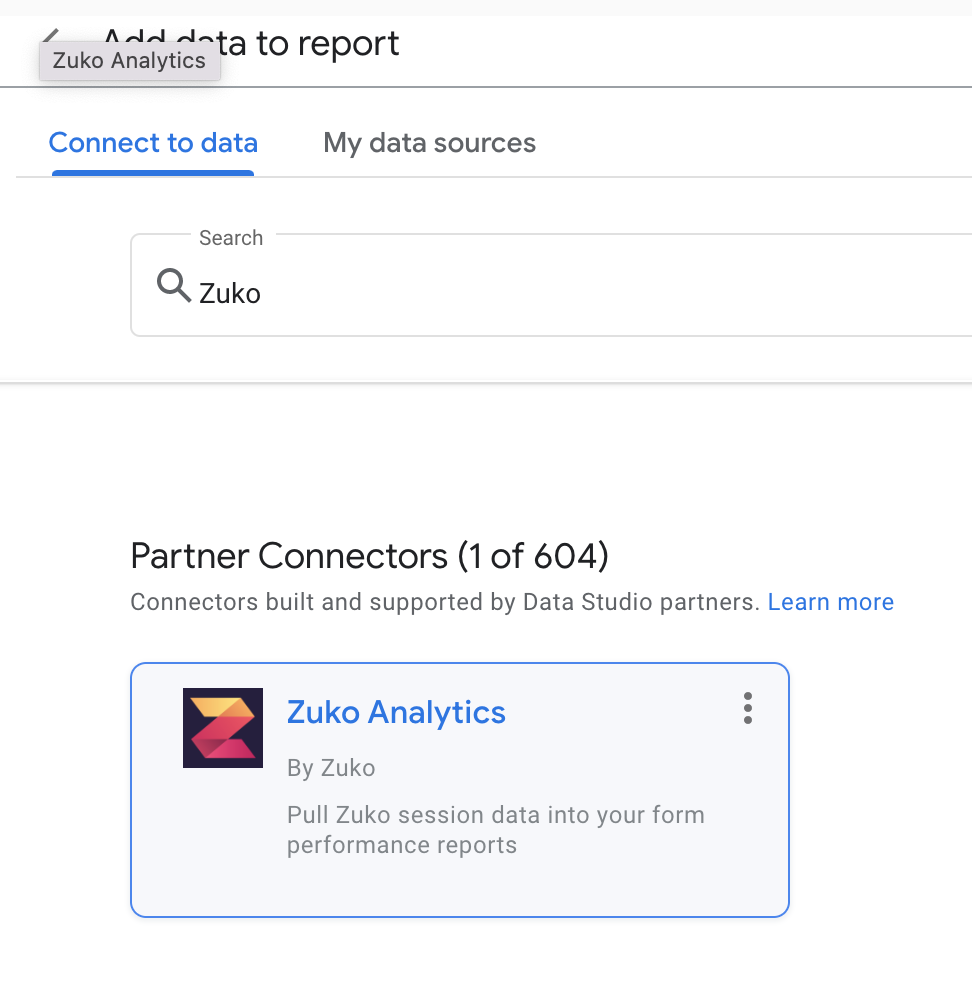
The Zuko Connector is available as a direct connection. Follow this link to connect:
https://datastudio.google.com/datasources/create?connectorId=AKfycbwrDoT-YOWzWa-NU_zQKu8rVO9-LX3HmbOphUk3an16UthqJ2pMNNAxW1WWqoDcYkx3
Or you can search for in in the list of Partner Connectors.
You will then need to Authorise that your google account can connect to this “external resource”.
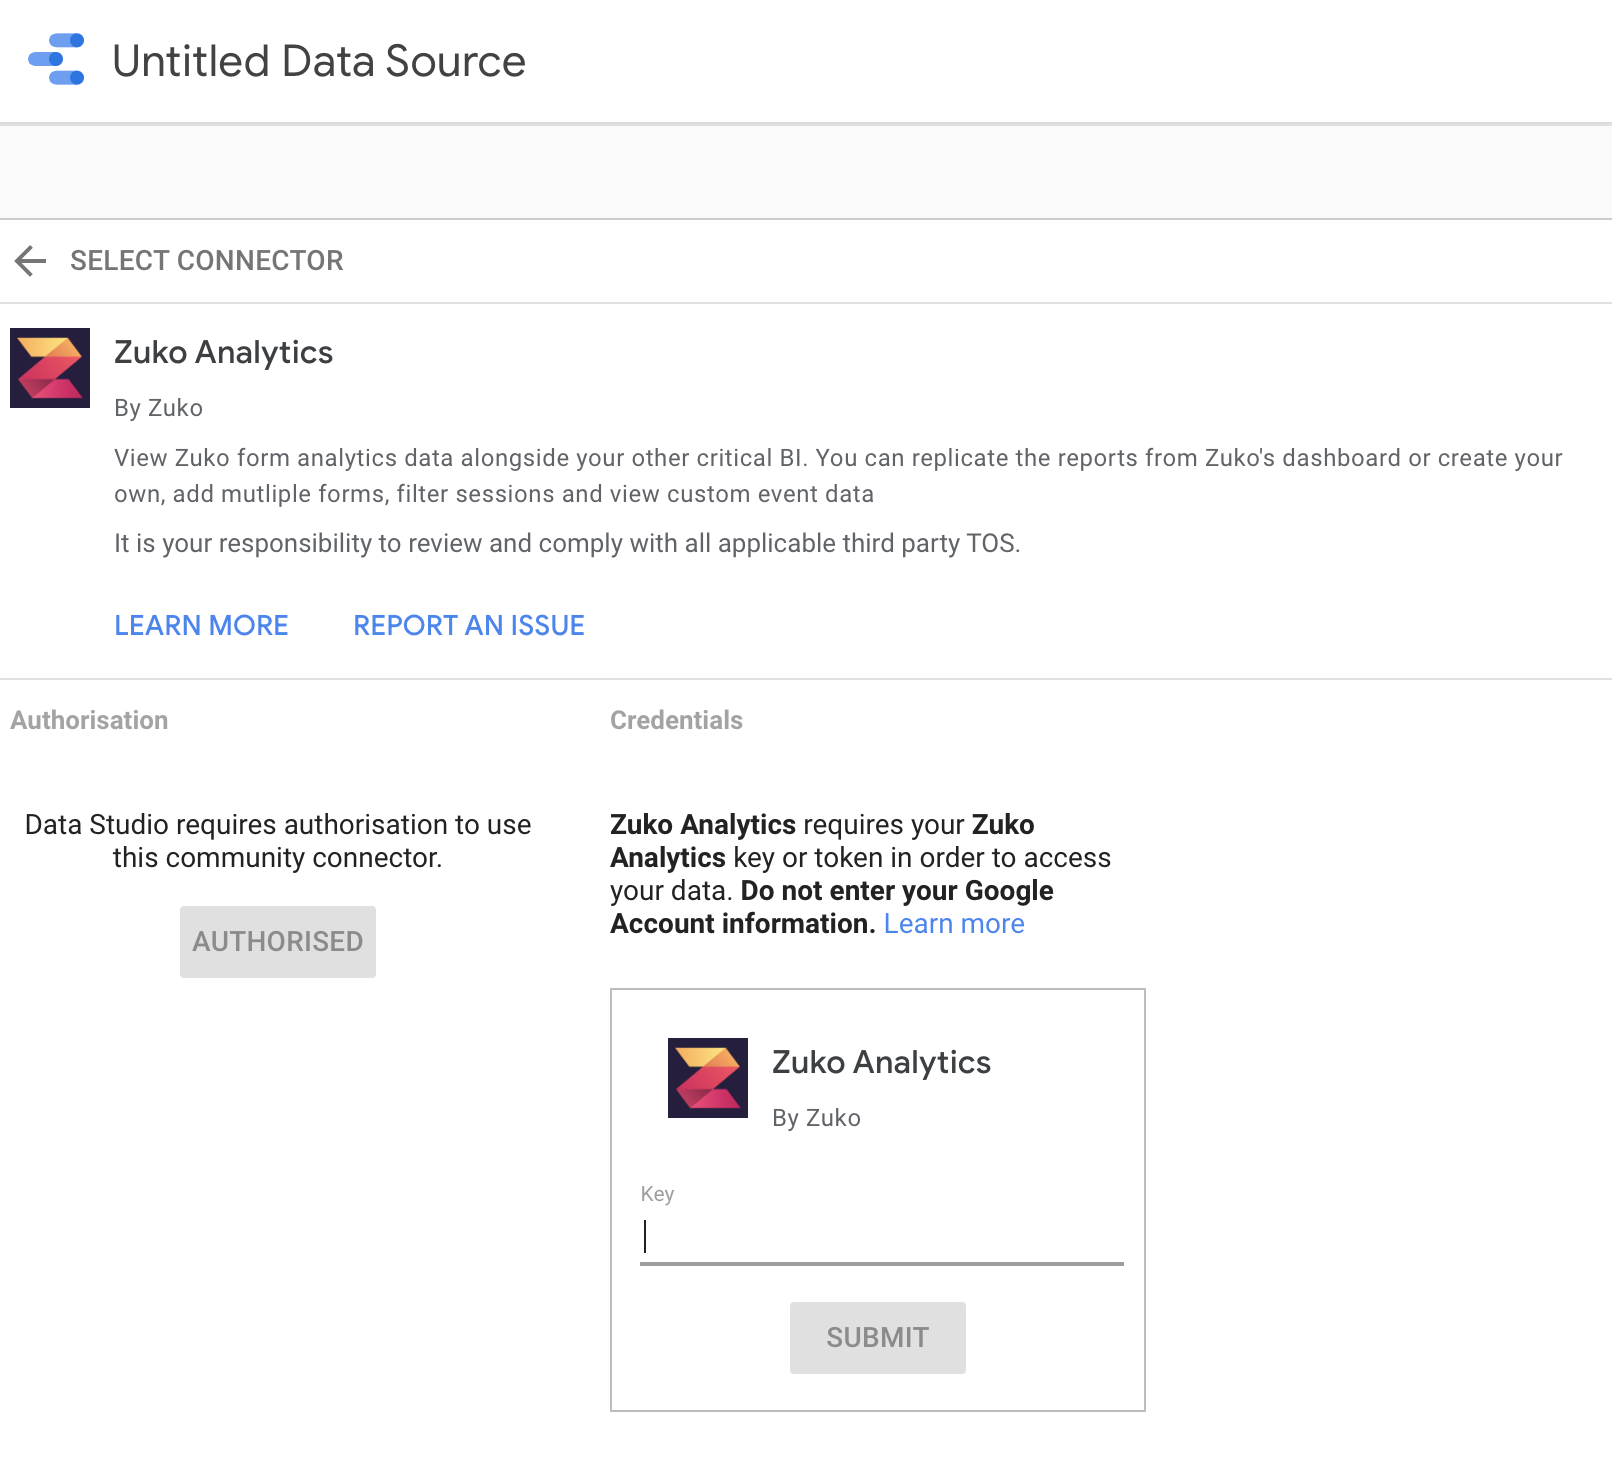
Step 3: Use the API Key
Now copy and paste the API Key you located in your user profile in the Zuko App, into the Credentials key. This gives you access to your forms’ session data.
Step 4: Connect to a Form
You will find the Form Uuid in the Zuko App. Go to a Form’s edit settings page either:
–> via a report page and click on the Form settings
–> or, in your Organisations > Forms > click Edit.

Copy this and paste it into the Connector. You can choose to start with the report template, then click Connect.
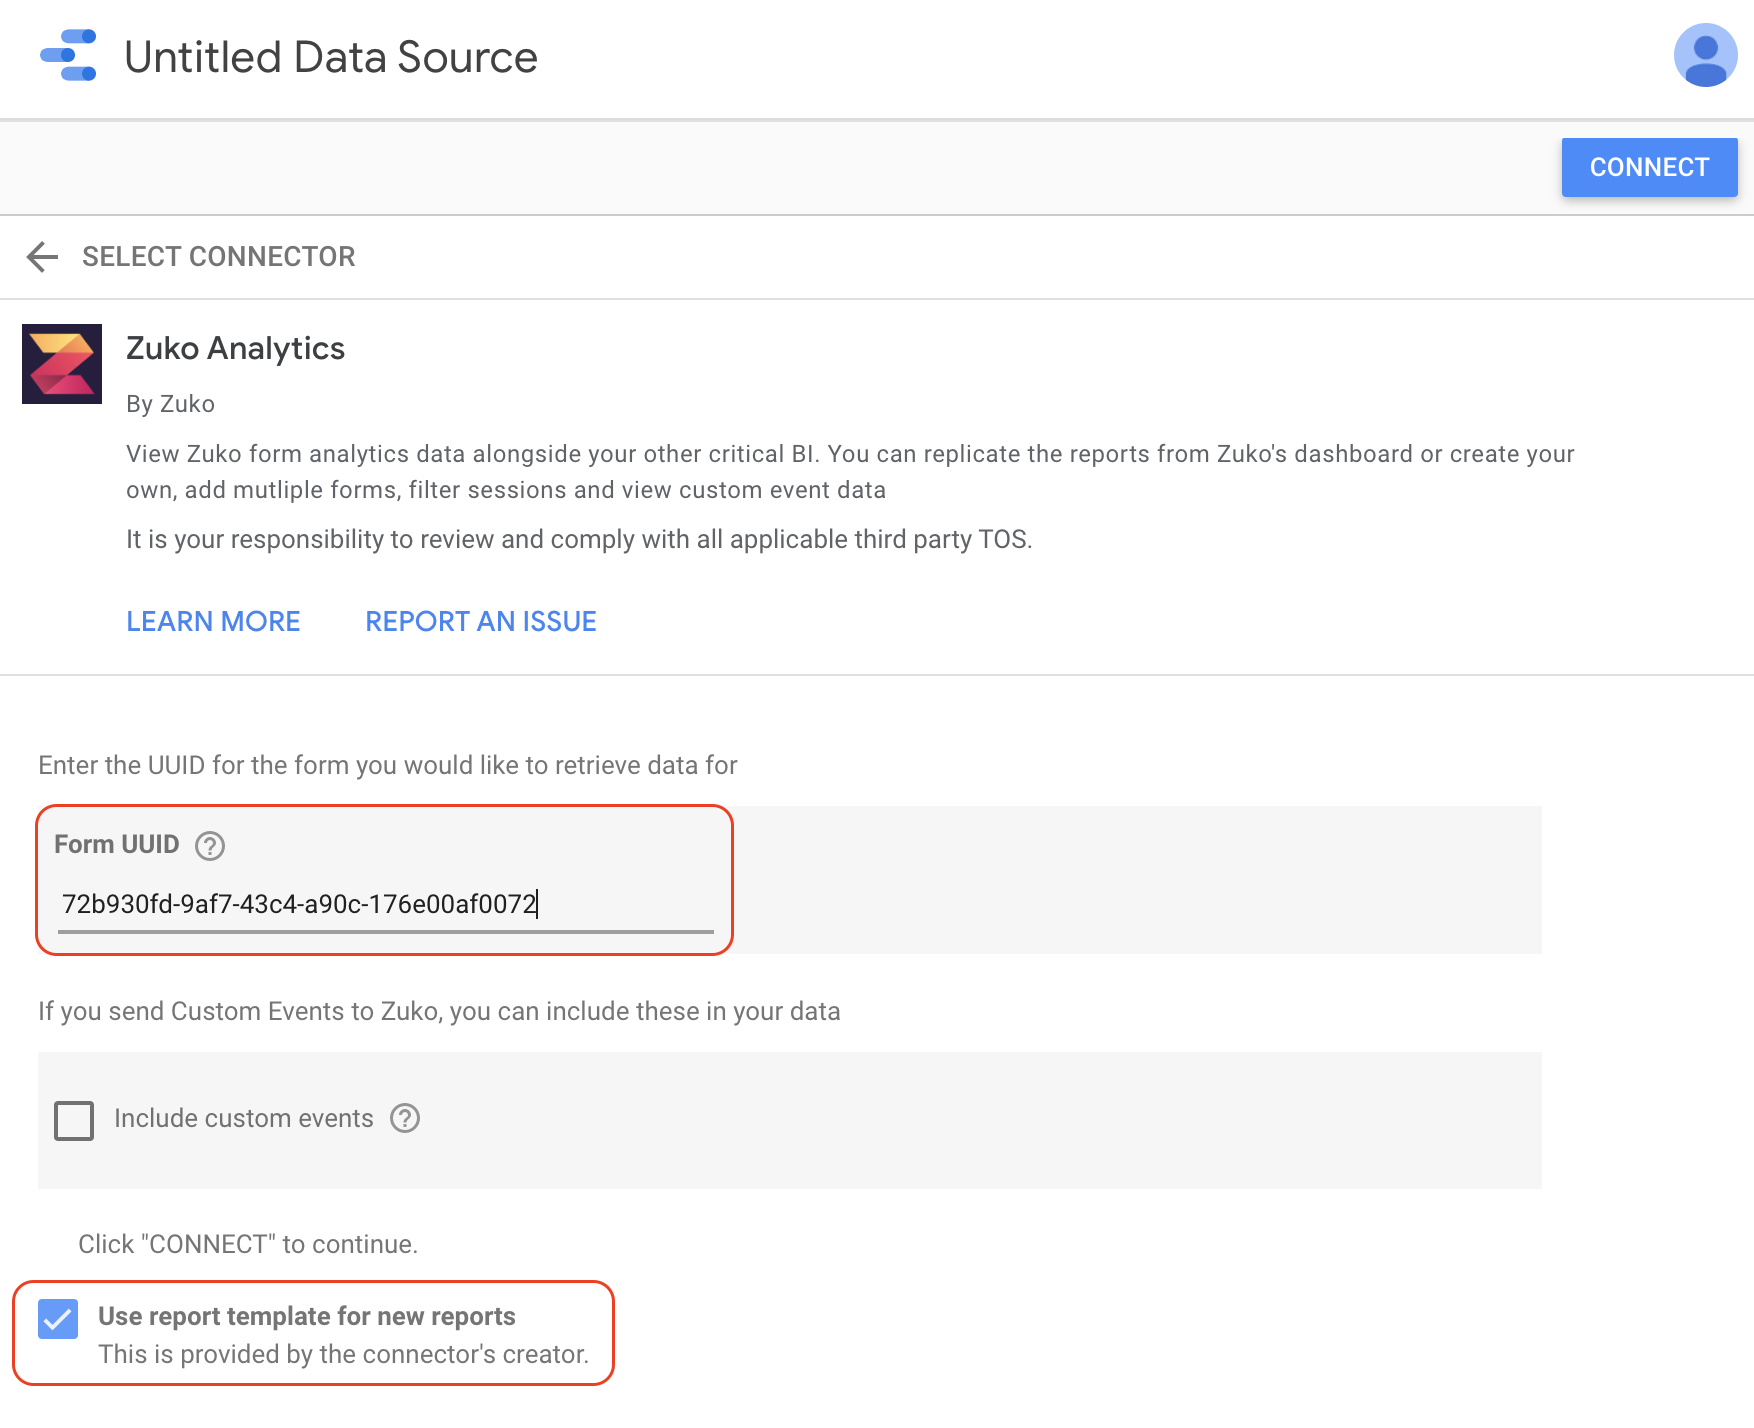
Tip: Currently, the Zuko Connector can connect one Form at a time. If you’re building a report to display Zuko session data across multiple Forms, you can add the connector multiple times to be a Data Source for each Form.
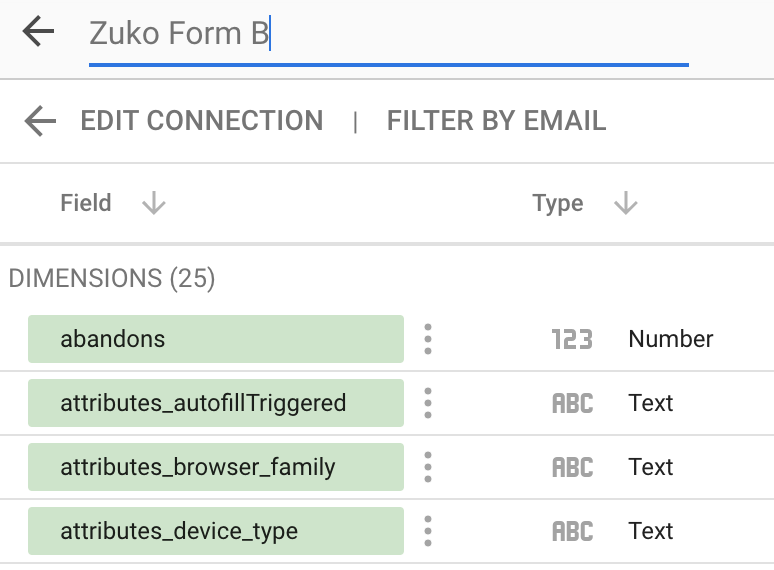
Step 5: Verify the fields
Here you will see all of the fields that you will be able to include in your report. Please take a moment to review the fields, the data types and brief descriptions.

Next click, Create Report and your first default table will be created for you.
NB. Currently, the Zuko Connector provides sessions only by day granularity. If you would like to explore more detailed granularity or would like to see the data in your form’s time zone please connect Zuko support to request these features.
Here is an overview of the fields you will see:
- date: The date in UTC when the session first received an event.
- visitor_id: A unique id of the visitor.
- duration: The duration of the session in milliseconds.
- views: A count if the session is viewed -> Use to see total Views.
- starters: A count if the session is started -> Use to see total Starters.
- completions: A count if the session is completed -> Use to see total Completions.
- abandons: A count if the session is abandoned -> Use to see total Abandons.
- viewed?: Determines if the visitor viewed the form.
- started?: Determines if the visitor started interacting with the form.
- completed?: Determines if the visitor completed the form.
- viewed_at: The time the visitor views the form. This is taken from the time of the formView event. If no formView event is received, this will not be set.
- started_at: The time the visitor starts the form. This is taken from the first event received when the visitor begins interacting with the form.
- completed_at: The time the visitor completed the form. This is taken from the time of the completion event. If no completion event is received, this will not be set.
- total_field_returns: The total number of times any fields have been returned to within the session.
- last_touched_field_(label|html_tag_name|html_type|html_name|html_id): The label or html attributes for the last field interacted with in the session.
- attributes_(browser_family|device_type|visitor_type|traffic_medium): Default attributes tracked by Zuko that you can use to filter your data.
- attributes_… (E.g. attributes_marketing-campaign): Custom attributes that have been tracked on your form, which can be used to filter your data
- event_…_count (E.g. event_email is invalid_count): A count of times that a given custom event has been tracked on your form.
Please contact Zuko support for any other fields you’d specifically like to see.
Step 6: Create your charts
Once you create the report you can create your first chart for your form’s headline stats: Views, Starters, Completions, Abandons.
Note that to replicate the totals you see in the Zuko App dashboard you must make sure you are using the fields labelled: views, starters, completions, abandons. These fields have a type of 123 Number, and that they are set to Sum in the report.
This default table should have been populated with the dimension date and the metric views. If not, you can add a similar table.
NB. If at this point the chart is taking a while to load, please go ahead and add a Date range control.

Then you can add in the remaining metrics: starters, completions and abandons.

Date range control
We recommend adding in a Date Range control - this will allow you to easily change the dates across all of your charts.

The default date range is 28 days. Whilst you’re setting up the report, we recommend using a range of a few days to a week. This should provide you with enough data to get the right data points for your charts.
Load times
Each time the chart refreshes, new data is fetched. This can take between 1-5 seconds on average. But for a wider date range which may reach 40k+ sessions, the charts can take up to 20 seconds to load and present your data.
We have seen load times over 1 minute so please be patient with your Google Data Studio report.
There is a working limit of up to 150,000 sessions that the charts can load in a reasonable timeframe. You may wish to review the possibilities of data extraction - which could mean you could extract and hold up to 100,000 sessions for a fixed time range.
We’ve taken all the necessary steps to optimise Zuko’s data within the connector. Please just let us know about your experience and we’ll support you.
Possible chart error
If you see an error like this below.

1. Please first try reloading the page. We have found that when handling a large number of sessions the chart can time out. But on page refresh, the data is immediately available.
2. Please check that the chart is using the main date range control and not its own unique range.
3. Minimise the date range to a day in case it is the volume of sessions that is causing a time out.
4. Check the metric and dimension combinations of the chart settings. We’re happy to help you get the chart setup that you’re looking for.
Zuko Template Report
You can view our template report here:
https://datastudio.google.com/reporting/30172e11-4027-4830-ac08-fea2c37e7400/page/KKRlC
This is setup using a demo form which holds up to 12,000 sessions a day.
Please wait for the chart to load - it can take ~30 seconds. Refresh the page if you see an error.
You can copy this report and add your own Zuko data into it by first clicking to Make a copy:

- Previously connected to Zuko Connector
If you’ve already connected to the Zuko Connector you can select it from the Available data sources. Click Copy Report and you will see the report populated with the Form you inputted during Connection.
If you’d like to edit this form, go to Resource > Manage added data sources > Edit > Edit Connection.
- Never connected to Zuko Connector
If you haven’t connected to the Zuko Connector before, then click Create data source and search the list of Partner Connectors.
Now enter your API Key from Step 1 above, and the Form Uuid from Step 4 above.
Adjust the date range to see more activity, such as this:

Embed the Zuko charts into your own report
If you already have another Data Studio Report, you can embed the Zuko report into your own following this guide: https://support.google.com/datastudio/answer/7450249#zippy=%2Cin-this-article
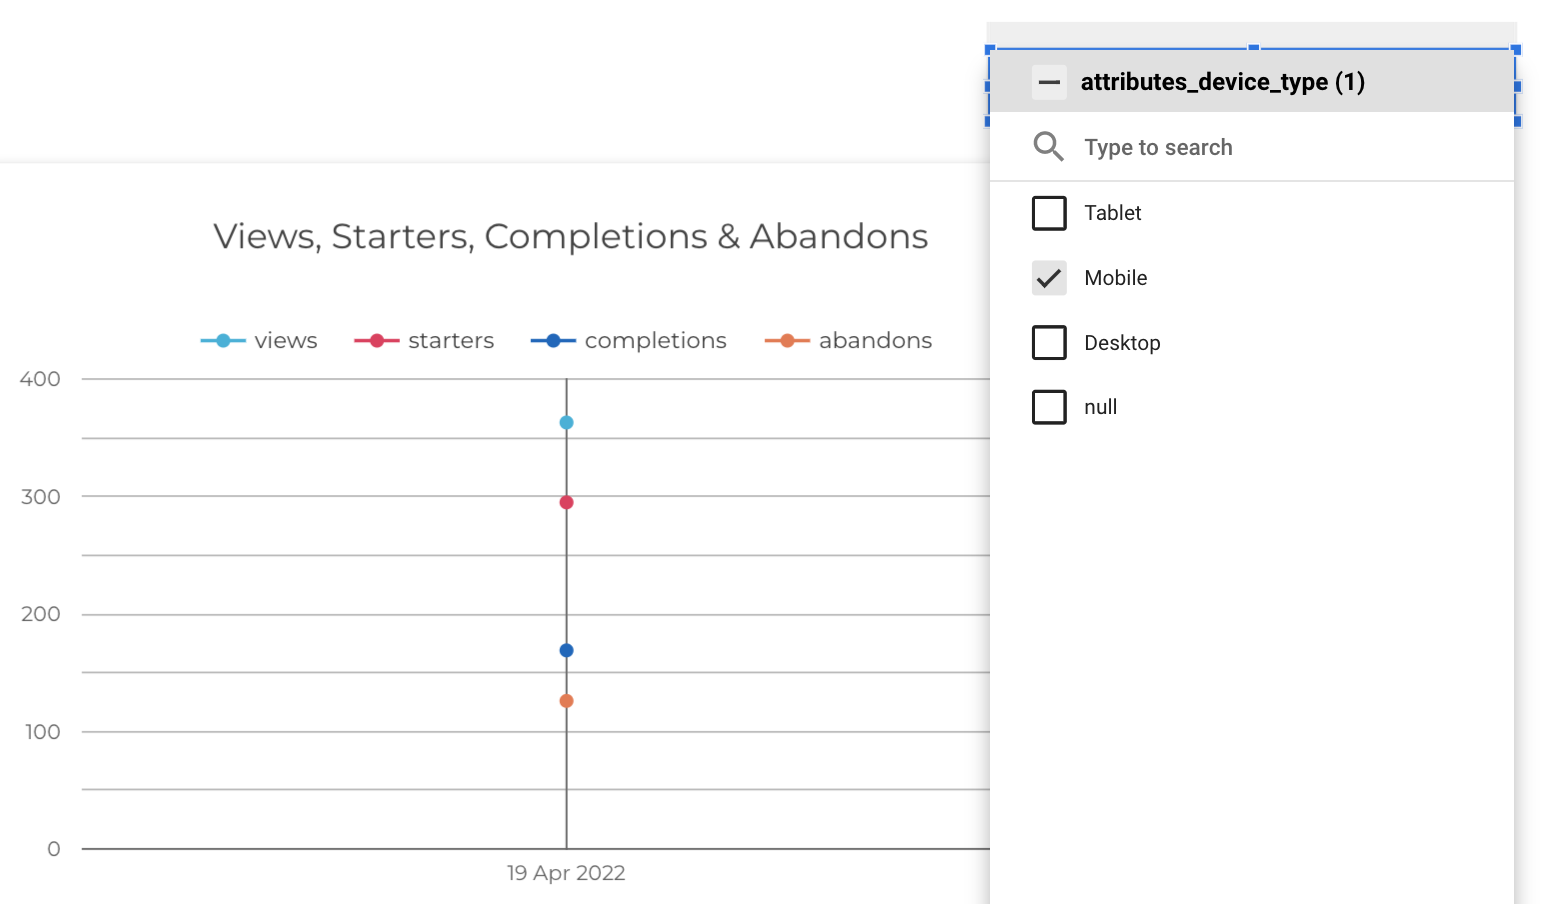
Filter your data by attributes
Zuko’s custom attributes are included in the data. You could add a Drop-down control to filter your chart data on certain attributes. For example here, we could have filtered the total sessions by Mobile:
NB. If you have already connected the connector, please go to Edit Connection > Reconnect, and you will see these new fields come through:

View custom events
Zuko’s custom events can also be included in the data. Go to Edit Connection (the step where you add the Form Uuid), and you will see a tick box to include custom events.

Then Reconnect and you will see a confirmation of the changes. This should include all the custom events that your form tracks. They will be prefixed with event_and are a count of the number of times that custom event was received.
NB. Only the top 50 custom events are included by default. Please contact us if you require more.

You can see an example chart showing custom events over time on Page 2 of our template.
Step 7: View multiple forms
You can add multiple forms to a report and view each form’s data in separate charts. Then you can ‘blend data’ to create a ‘blended data source’ to view multiple sets of form data in the same chart.
Connect more forms
To add multiple forms to your report, you simply Add Data, search for Zuko, and you will see the Connector that you already have connected.
Select this and add the next Form Uuid you’d like to use.
You can now duplicate a chart, or change the data source to this new one to see charts alongside each other for different Forms.
You can rename the name of each Data Source if you wish - just click on the name.
Blended Data
Once you’ve added multiple forms to a report, you can then create a blended data source to view all form’s data on one chart.
Go to Resource > Manage blends > Add blend
Then ‘Join another table’ and select another data source:

Click ‘Configure join’ and select Cross.

You then add in the same metrics across both forms that you want to include in this blended data source, for example VSCA (Visitors, Starters, Completions, Abandon) totals would be:
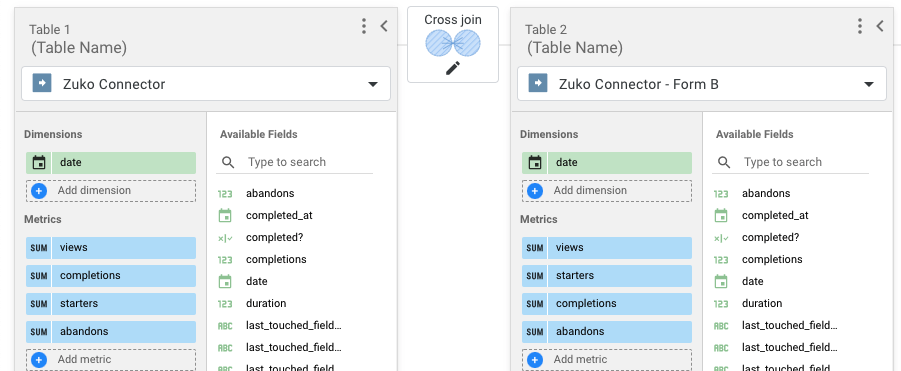
You can add all metrics from all connectors if you wish.
Then click Save, and you can use this Blended data just like a data source.

We’re happy to support your setup so please just let us know how it’s going and contact us at support@zuko.io if you need any help.
Want to get started with Zuko?
Start a free trial that includes all features, or request a demo