
How Form Analytics Helped Uncover a £2.725 Million Checkout Opportunity
A case study showing the value of form analytics in real life
The biggest test win of my career came from form analytics
Abi Hough, Founder, UU3
The Summary: Key Insights and Fixes
A UK retailer's checkout optimisation programme, driven by insights from Zuko Analytics, delivered experiments representing a projected £2.725 million in additional annual revenue.
The retailer knew it had a checkout problem: 41% of customers failed to progress beyond the initial personal details page. But traditional web analytics could only reveal where customers were abandoning, not what was causing them to struggle.
Using Zuko's field-level form analytics alongside usability research, the optimisation team identified specific sources of friction that were costing the business potential customers. Three findings were particularly revealing:
1. Months at address: The field customers didn't need
The insight: Form analytics revealed that a dropdown asking customers how many months they had lived at their current address accounted for 17.55% of recorded field drop-off events. Further investigation showed that customers frequently overlooked the field and encountered validation errors. The most commonly submitted value was zero.
The fix: Rather than redesigning the dropdown, the team challenged whether it was necessary at all. Following discussions with stakeholders, the visible field was removed, with a default value of zero submitted behind the scenes.
2. Email address: Existing customers hitting a dead end
The insight: Email address and confirmation fields accounted for 26.44% of recorded field corrections. Further research revealed that returning customers entering an email address already associated with an account were encountering problems late in the registration process, after completing much of the form, without sufficiently clear guidance on how to proceed.
The fix: Email entry was moved to the beginning of the form, with earlier inline validation to identify existing accounts and help customers avoid unnecessary form completion and confusing account-recovery journeys.
3. Address lookup: Customers missing the easier route
The insight: Behavioural research revealed that customers were frequently overlooking the postcode lookup button and manually entering their full address instead, creating unnecessary effort and friction.
The fix: The address form was redesigned around a lookup-first experience. Customers initially saw only the house number and postcode fields, with additional address inputs revealed when needed.
The Commercial Impact
The programme combined form analytics, user research and iterative A/B testing to deliver two successive improvements:
- +2.9% overall conversion uplift reported by Google Analytics in the initial experiment, equivalent to approximately £2.32 million in projected additional annual revenue.
- A further £405,000 in projected annual revenue from a subsequent optimisation iteration.
- £2.725 million in combined projected additional annual revenue from the two iterations.
These figures represent annualised projections based on historical experiment results, rather than revenue already realised. The outcomes reflect the combined optimisation programme, not any single field change.
The Full Report : The £2.725 Million Hiding in a Checkout Form
How behavioural evidence, business negotiation and iterative experimentation helped a UK online retailer uncover a multimillion-pound opportunity.
Nobody gets particularly excited about checkout forms. They're functional, necessary and, compared with the shiny things happening elsewhere on an ecommerce website, not especially glamorous.
But they're also where customers are asked to do some of the hardest work: provide personal information, create an account, satisfy unfamiliar requirements, recover from errors and make decisions about how to pay. All while trying to do something relatively simple: buy something.
Several years ago, I worked on a UK retailer's checkout that was making this unnecessarily difficult. What followed wasn't a quick tidy-up of a few fields. It was a programme of research, cross-departmental negotiation, design, end-to-end testing and iterative experimentation. The combined result was a projected £2.725 million in additional annual revenue.
Not bad for something most people would consider a fairly boring form.
Finding an opportunity amongst 682 problems
The checkout work emerged from a much wider investigation of the website. Across the research programme, we'd identified 682 usability issues, including 82 classified as high priority. That was plenty of material for a very long list of things to fix. The harder question was which problems were genuinely worth tackling first.
We examined the findings alongside journey performance, behavioural evidence and potential commercial impact. One part of the experience stood out: the personal details page at the beginning of checkout, where new customers provided their information and created an account.
Approximately 41% of customers failed to progress beyond that page. On mobile it was 42.9%, and mobile accounted for around 63% of users. There was clearly a sizeable opportunity, but the abandonment figure wasn't an explanation. It told us where people left, not why.
Triangulating the evidence
Our investigation brought together web and funnel analytics, Formisimo field analytics, moderated lab sessions, usability testing, session recordings, eye tracking, heuristic evaluation and functionality testing. Each method answered a different question and helped us challenge what we thought we'd learned from the others.
Formisimo, now known as Zuko, was particularly useful because it let us examine behaviour inside the form. Instead of seeing only a page-level exit, we could identify individual inputs associated with corrections, time spent and drop-offs.
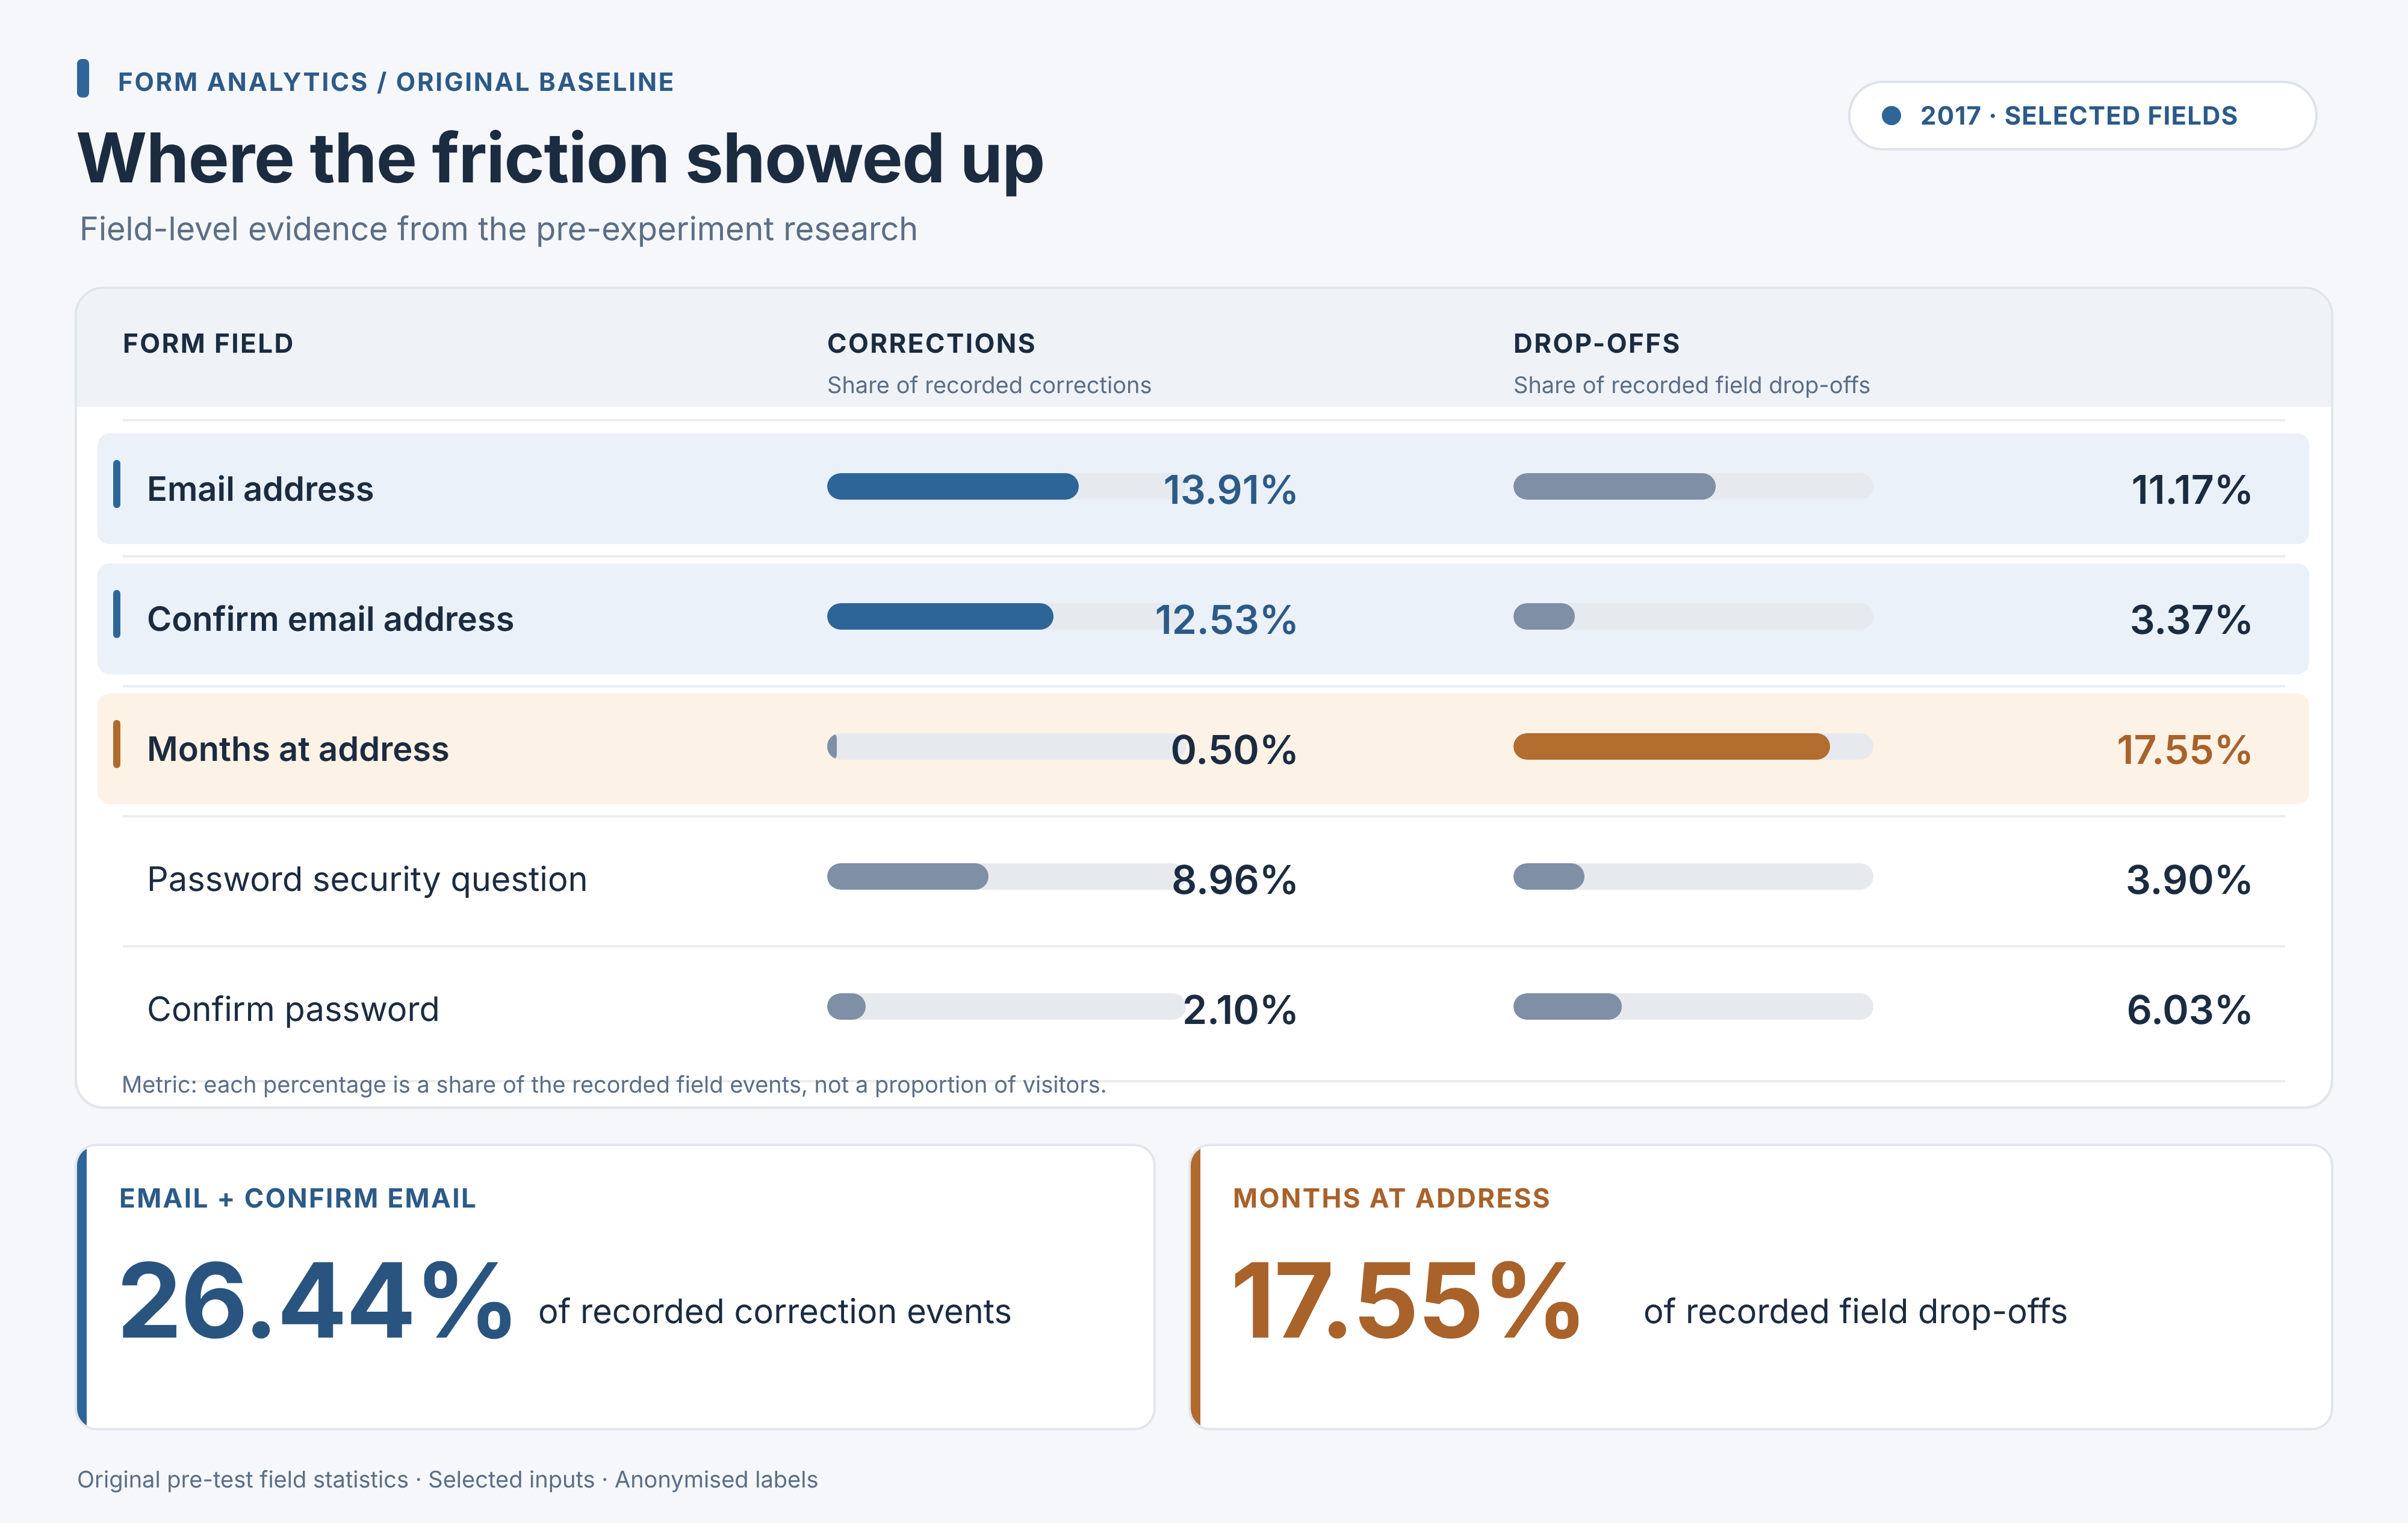
The original field-level analysis highlighted some striking patterns. Email address and confirmation together accounted for 26.44% of recorded field corrections. Password and security-related inputs also warranted attention. And the dropdown asking customers how many months they'd lived at their current address accounted for 17.55% of recorded field drop-offs.
That 17.55% was a share of the field drop-off events in the original analysis, not the proportion of all customers abandoning because of that one input. It was a diagnostic signal, not a causal verdict but a very good reason to investigate.
The qualitative work supplied the context. Customers encountered confusing validation, unclear password rules, repeated information requests and competing content. Some overlooked the postcode-lookup action and entered their address manually. Others scanned the long form before starting, perhaps assessing how much effort lay ahead.
What we were finding wasn't one spectacularly broken component. It was an accumulation of small obstacles that, together, made checkout needlessly demanding.
Making every interaction earn its place
Identifying friction was one challenge. Persuading the business to change the fields was another.
A checkout isn't an isolated interface. The data it collects can feed account creation, credit decisions, order fulfilment and internal reporting. Different departments wanted different information and marketing, unsurprisingly, wasn't always delighted by the prospect of collecting less of it.
I put together a field-by-field review to establish what could legitimately be removed, what had to remain and what could be requested in a less demanding way. That meant talking to the departments receiving the data, understanding how it was used and negotiating where customer needs and operational requirements could meet.
We weren't assuming fewer fields would automatically make a better checkout. Some information was genuinely necessary; other requests could be removed, reused or made optional. Every interaction needed to earn its place - and we needed to understand the consequences before changing it.
Iteration 1: Making the task feel manageable
One of the principles informing the design work was self-efficacy: the belief that you can successfully complete the task in front of you. A form that looks formidable, asks unfamiliar questions or keeps telling you something is wrong can undermine that confidence.
Our hypothesis was that reducing unnecessary effort, improving clarity and removing distractions would help more customers progress. The first redesign focused on the overall structure of the experience, not simply making individual fields look nicer.
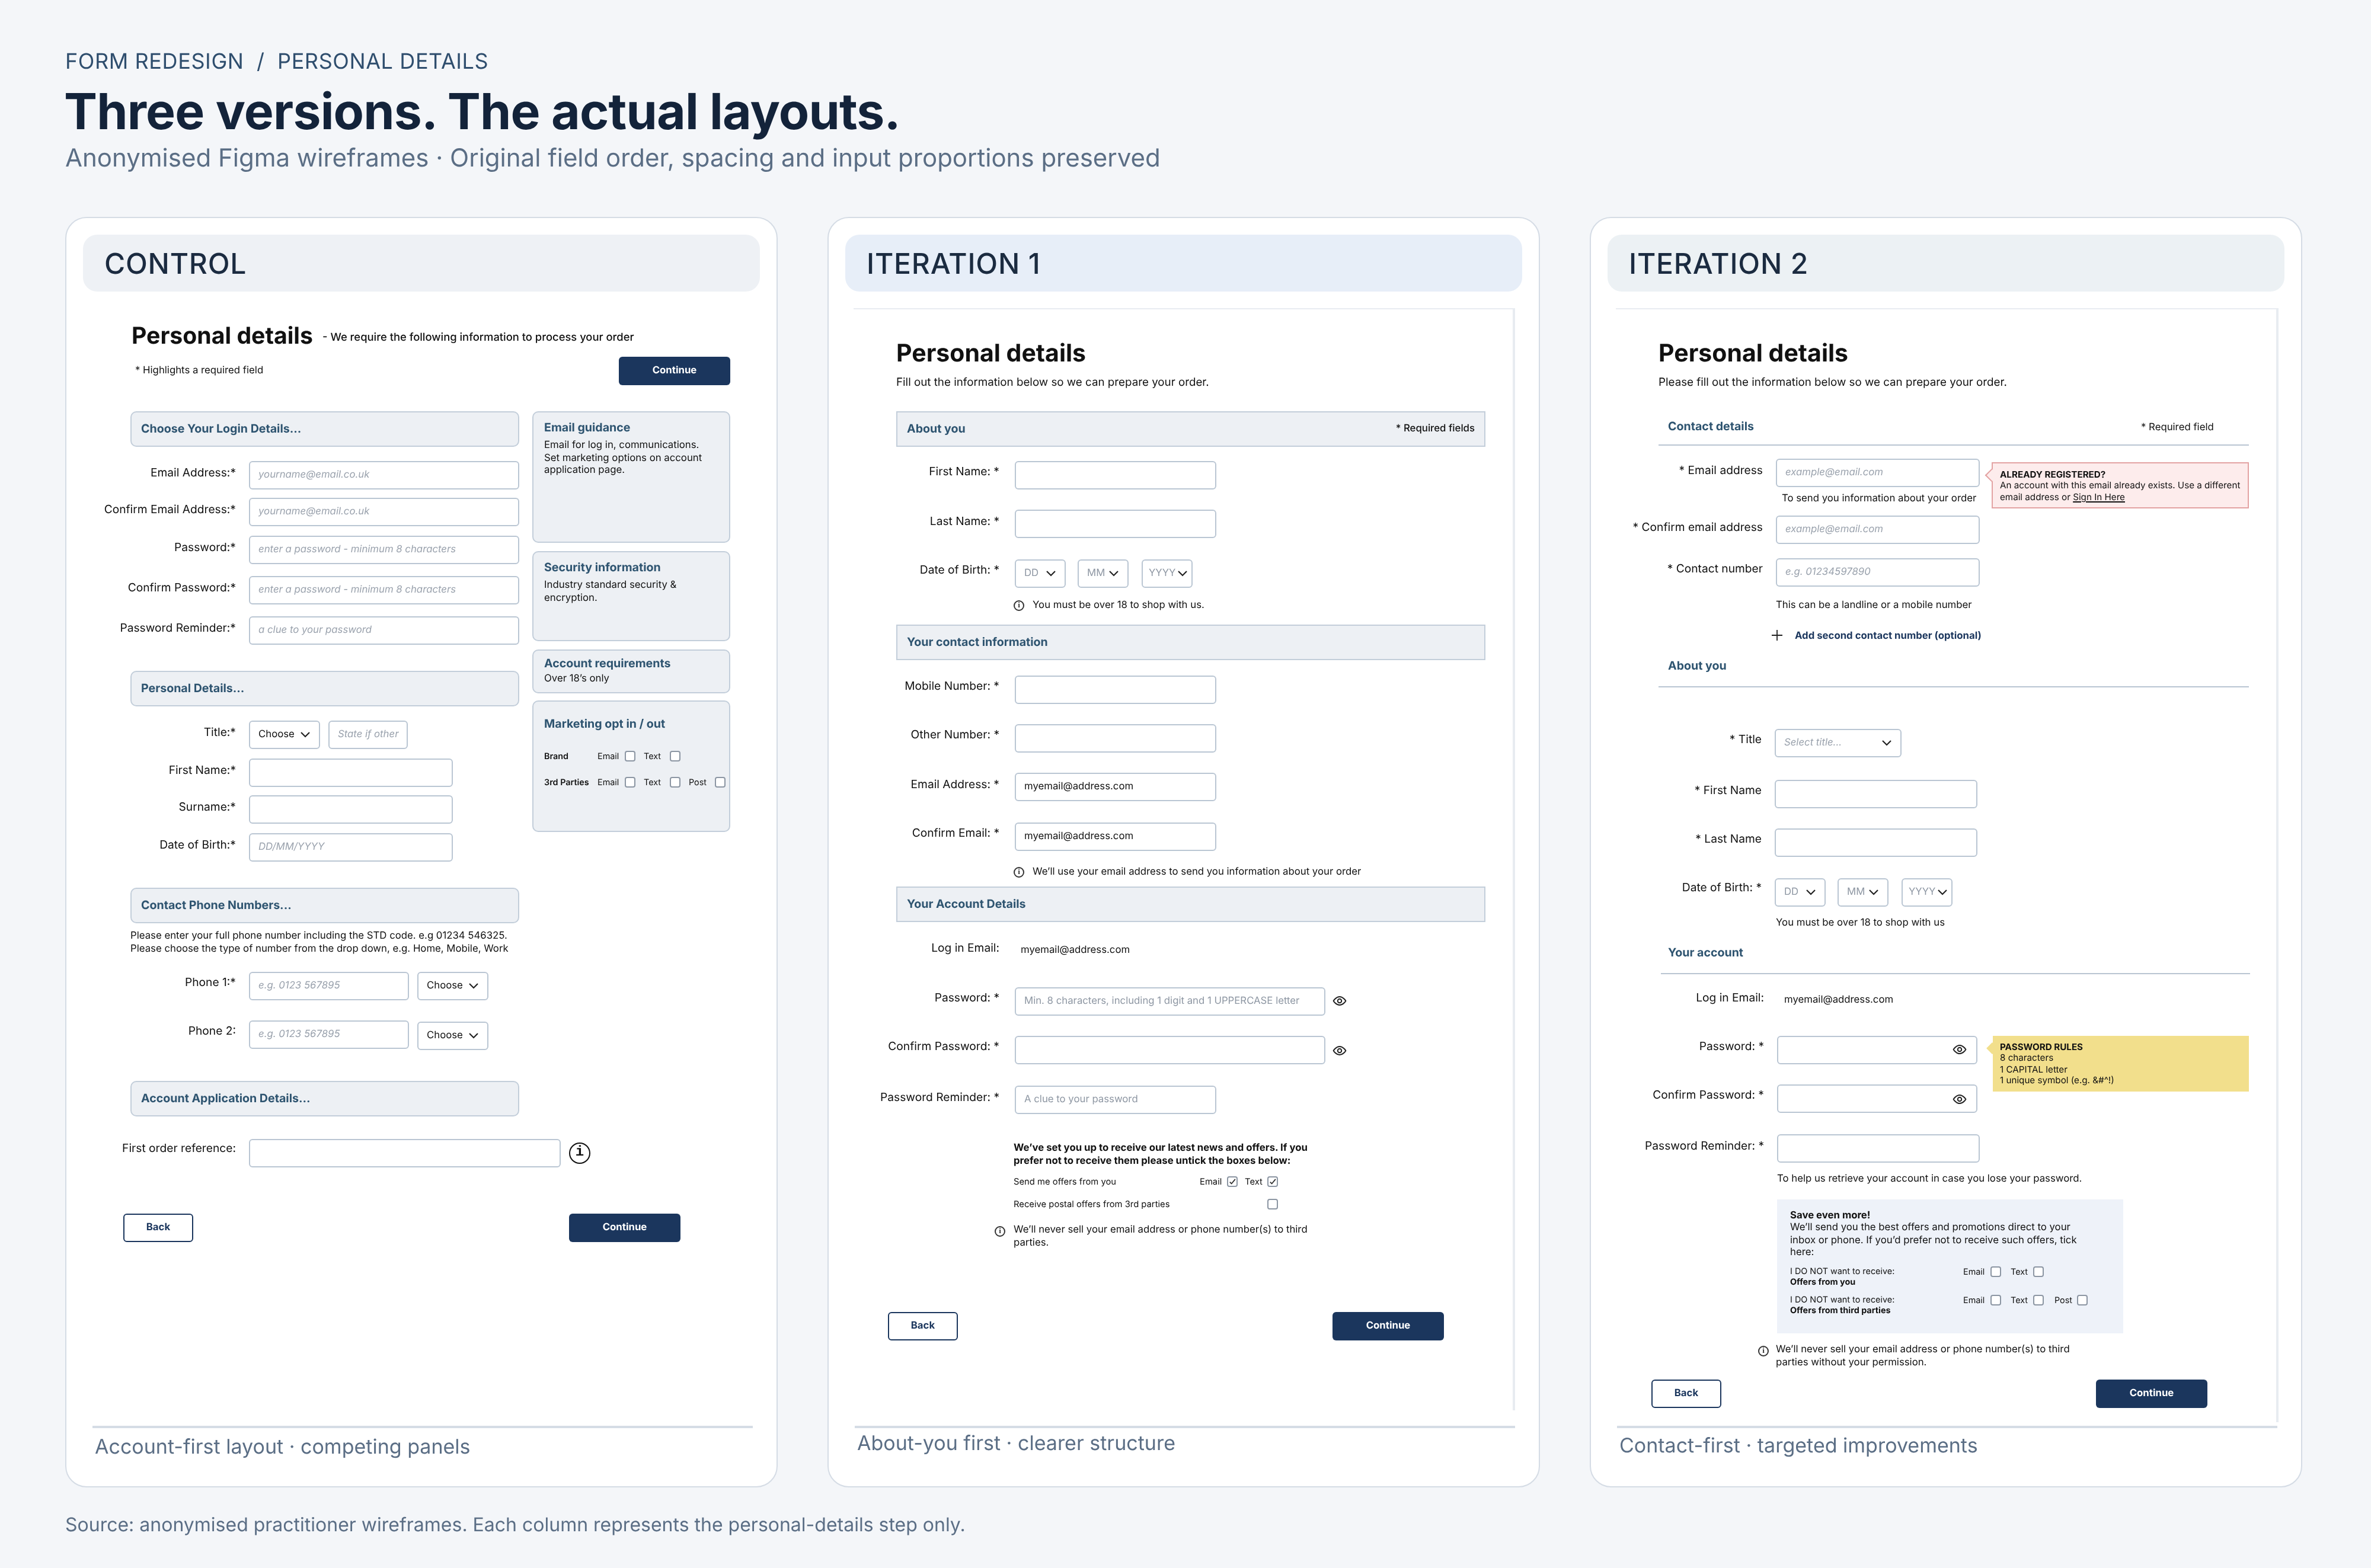
On Personal Details, we removed the competing right-hand information panels and created much more breathing room. We put the 'About you' section first, grouped contact and account information more clearly, placed guidance next to the relevant inputs and removed the first-order-reference field and phone-type selectors. The date-of-birth interaction was also reworked into separate selectors with contextual guidance.
But this wasn't a wholesale purge. Email confirmation, password confirmation and a second phone-number field remained in V1. They were still part of the experience and therefore still available for further investigation.
On Address Details, the sidebar disappeared, headings became clearer and guidance was better positioned. Yet most address inputs were still exposed at once, and customers were still asked to select both years and months at their current address. The design was clearer; some underlying friction remained.
The objective wasn't simply a prettier checkout. It was a process that felt more understandable and achievable. And, however well informed, that was still a hypothesis we needed to test.
Making sure the business could still take the orders
There was a sizeable piece of work between an approved design and a live experiment: making sure nothing broke downstream.
We repeatedly tested form behaviour and checked what arrived in the back-office systems. Test purchases carried unique identifiers, so we could trace individual transactions and compare what the tester submitted with what the business actually received.
We repeated those checks in production, outside core trading hours. Only a small proportion of customers initially saw the experiment, and traffic was ramped up as confidence in the implementation increased.
Because increasing conversion isn't much of a win if you've accidentally broken the systems responsible for processing the additional orders.
The first win (and why we kept looking)
One documented experiment ran for 21 days on Qubit across mobile, desktop and tablet, with a reported 80:20 control-to-variation allocation. It measured both progression beyond Personal Details and overall conversion.
Qubit reported +1.98% conversion uplift with a 99.47% probability of uplift, and +1.88% successful completion of the Personal Details page with a 99.98% probability of uplift. Google Analytics reported +2.9% overall conversion uplift.
The device split was a useful reminder that there is rarely a universal winner: Google Analytics reported +5.0% on mobile, +3.3% on tablet and −2.8% on desktop. There was clearly more to learn.
On the Google Analytics figures, the result translated into approximately £2.32 million in projected additional annual first-time customer revenue. That was an annualised estimate based on experiment performance not revenue already banked.
But a winning experiment doesn't mean you've finished improving the experience. We continued watching how people used the revised checkout, and the next round of research gave us more specific problems to solve.
Iteration 2: Fixing the friction that remained
Where V1 had tackled the overall form structure, V2 was more targeted. The revised Personal Details design moved email entry to the beginning, so an existing account could be identified through earlier inline validation. Previously, some returning customers only discovered an email conflict after completing the form, sending them into a confusing sign-in or password-recovery journey.
We also made the second contact number an optional, expandable interaction. Password visibility controls moved inside the fields, the creation rules became more prominent, and marketing choices were presented more clearly. These changes were informed by lab observations, recordings and functionality testing not an assumption that another general tidy-up would solve everything.
And we didn't change things for the sake of it. The follow-up research suggested that parts of the 'About you' section were working satisfactorily, so the V2 work concentrated on the interactions that still needed attention.
Address lookup: Changing the sequence, not just the button
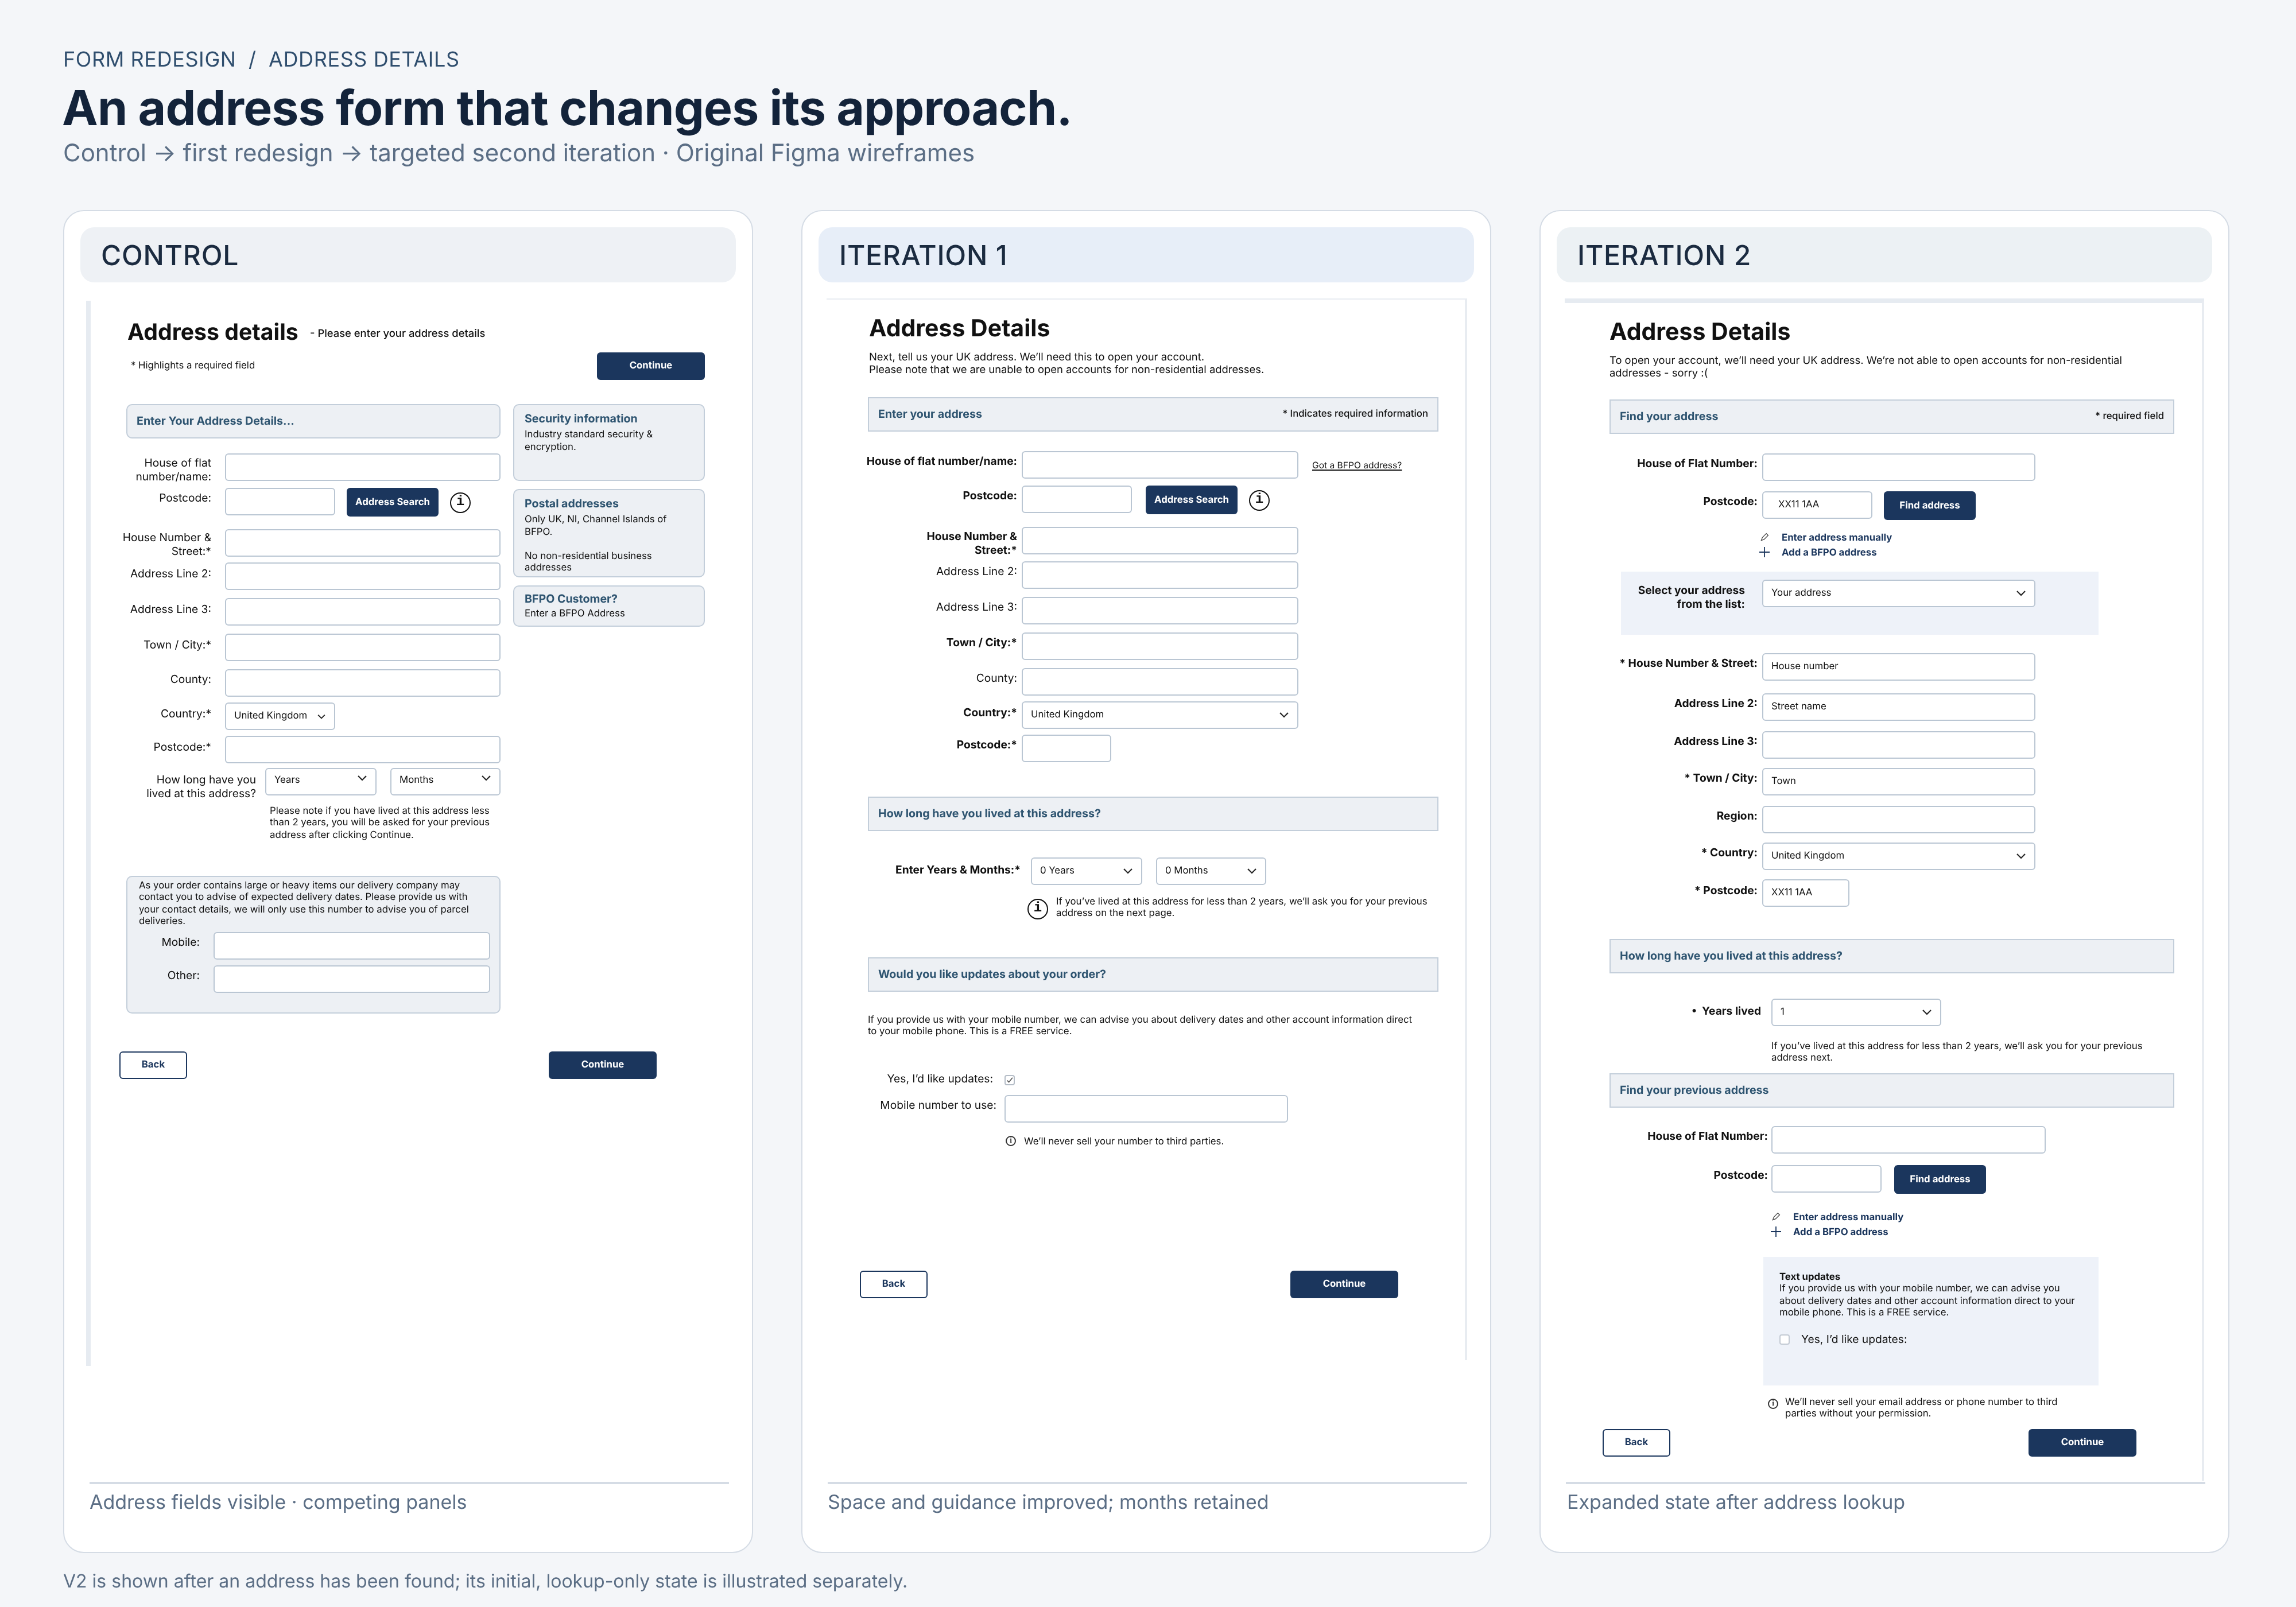
The address page exposed another behavioural problem. Customers entered their house number and postcode, missed the address-search action and started filling out the full address manually. Making the button slightly more noticeable wasn't necessarily going to fix an interaction that encouraged people to work around it.
V2 restructured the experience as a lookup-first interaction. On initial load, customers saw the house or flat number and postcode inputs, alongside the option to enter an address manually or use a BFPO address. After the lookup, an address-selection control and the remaining address details became available. The later expanded state could also request a previous address when the customer's residential history required it.
The two V2 address wireframes therefore show two states of the same checkout step, not two separate checkout pages. The difference matters: instead of confronting customers with everything up front, the interface revealed the next task when it became relevant.
The curious case of the months-at-address dropdown
One tiny field provided a particularly good example of why the investigation had to go beyond the dashboard.
Formisimo had highlighted the months-at-address input as a prominent drop-off signal. Subsequent usability observations showed customers entering the number of years they'd lived somewhere but overlooking the separate months dropdown — then running into validation errors when they tried to continue.
We could have made the dropdown more obvious. Instead, we asked the stakeholder responsible for the information another question: among customers who successfully completed checkout, what value did they most frequently select?
Zero.
Were all those people genuinely calculating their residential history to the nearest month? Or were some selecting zero simply to get through the form? We couldn't prove their motives from the data alone, and zero was undoubtedly accurate for some. But it called the value of the explicit question into doubt.
Combining the field-level signal, observed validation errors and downstream data gave us grounds to challenge the requirement. After working through the business's needs, we agreed that the visible months dropdown could be removed and the system could submit a default value of zero instead.
That was a deliberate, agreed business trade-off, not a claim that zero precisely represented everyone's residential history. We retained the required data structure and verified it through the same end-to-end QA process, while customers no longer had to interact with a field that had been getting in their way.
We hadn't just made a problematic field easier to complete. We'd established that customers didn't need to complete it at all.

The commercial result
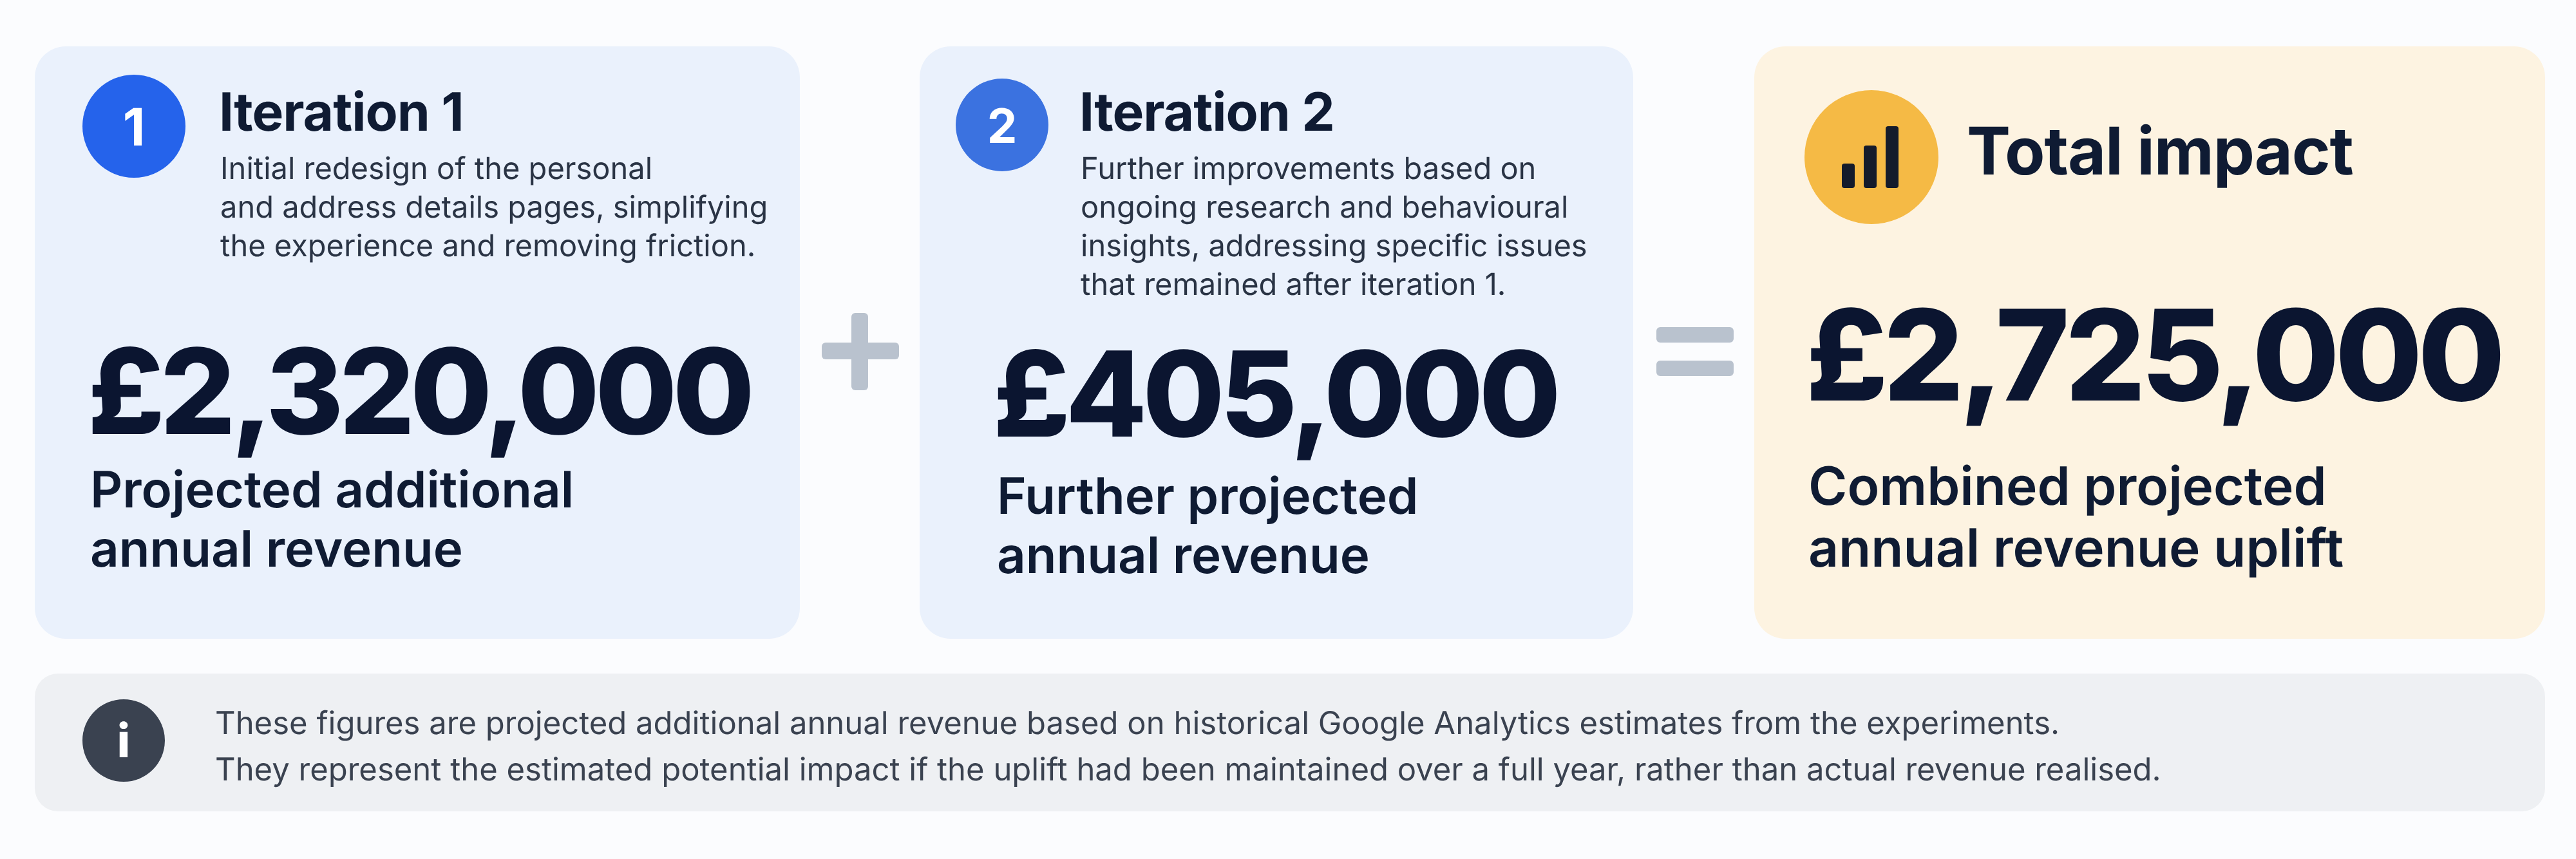
The initial experiment generated the £2.32 million annualised forecast above. A subsequent iteration contributed a further £405,000 in projected additional annual revenue, according to my historical Google Analytics results summary.
Taken together, those separately recorded incremental forecasts totalled £2.725 million in projected additional annual revenue. They are modelled annualised outcomes from the experiments, not a claim that £2.725 million had already been realised and certainly not money attributable to a single dropdown.
What the supposedly boring form taught us
This programme didn't create value because we spotted a field with an alarming statistic, or because one tool told us what to redesign. We connected different kinds of evidence, challenged what the business actually needed to collect, turned that understanding into workable designs, tested the data end to end, deployed cautiously and measured the result.
Formisimo/Zuko played a distinctive part: it revealed the interactions within the form that ordinary page-level analytics couldn't. The wider research helped explain the behaviour; stakeholder conversations made sensible changes possible; and experimentation established whether our ideas worked.
Most importantly, we kept asking questions after the first win. That's how you find the next £405,000 rather than assuming the job is done.
We didn't need to persuade more people to visit the website. We needed to make it easier for the customers already there to finish what they'd come to do.
Because forms might be boring. But the money you're losing through them certainly isn't.
About the Author
Abi Hough
Founder, Corpus
Abi Hough is a UX, experimentation and accessibility strategist. Her work examines the gap between what organisations claim, what their systems communicate and what people ultimately understand.
LinkedIn ProfileWe wrote the book on form optimization!
"The best book on form design ever written - 80 pages of PURE GOLD"

More from our blog:




Want to get started with Zuko?
Start a free trial that includes all features, or request a demo