
Form Analysis: The Basics of How to Analyze Web Form Performance
Advice on the basic principles of using data to analyze your web form or checkout
Understand the fundamentals needed to optimize your webform or checkout
Mastering form analysis is a key part of becoming good at conversion rate optimization, particularly if you are dealing with industries that drive a large part of their customer acquisition through their web site (think finance, insurance, education, gaming, eCommerce and many more).
This article is designed to give beginners and enthusiastic amateurs an introduction to the basics of form analysis so you can get started on improving your conversion rates right away. Zuko has also produced a comprehensive eBook guide to Form Optimization and Analytics and a Step by Step guide to Optimizing Forms so check those out if you want a more advanced overview of the topic.
What is Form Analysis?
At its core, form analysis involves using data to understand how users are behaving when attempting to complete a web form. More specifically, it can be utilised to reveal which areas of the form are causing users enough difficulty that they abandon the form and don’t come back. A conversion rate optimization practitioner can use form analysis to determine whether dropouts are being caused by usability issues, unclear copy, unhelpful error messages or simple technical or rendering faults. These insights can then be used to amend the form to eliminate the friction and so improve the completion rate of the form, meaning the business acquires more customers or leads without having to increase their marketing budget.
The core building blocks of any form analysis process are:
1. Ensure you have the data
Without accurate data any attempt to analyse a form will be reliant on assumptions and opinions, a recipe for HiPPO-based decision making. Research typically shows that decisions made by the “Highest Paid Person” tend to be manifestly inferior to conclusions based on, and interrogated by, actual facts.
In practice, this means you need to have a reputable form analytics tool installed on your webform to track user behaviour data and render it in a usable dashboard. As you are on Zuko’s website we’ll obviously take the opportunity to pitch Zuko as the most comprehensive, focused and powerful tool available but, if you are so minded, there are a number of reputable providers out there that would do the trick.
2. Examine the macro trends
Whilst the success of any form optimization project will inevitably involve getting deep into the details, it’s also important to take a step back and see how the form is performing overall.
You should be looking at the following metrics and how they have been trending over time, especially in response to any changes in the form.
Form Starter Rate - When people reach the form do they actually start it, or do they not even bother to interact with it at all? If you have a low starter rate it could be an indicator of one of these issues:
- The form is too daunting and scares users off
- The incentives for completing the form are not clear - the user should know what the benefit of spending time completing it are
- The instructions are confusing, putting off the users
- There is a technical issue that is stopping the form loading in some or all cases (e.g. on different browsers or devices)
- The wrong audience is being driven to the form - they are not interested enough to start
Starter to Completion Rate - Of the users who do start the form, what proportion end up successfully completing it? This metric is more reflective of whether there is a problem with your form itself. Users who have the motivation to start but not complete the form must have been put off by something so a declining starter to completion rate should raise a red flag for you.
View to Completion Rate - This combines the previous two metrics. Of those who reach the form’s page, what proportion convert? This is always interesting to track but without further segmentation may not be particularly insightful.
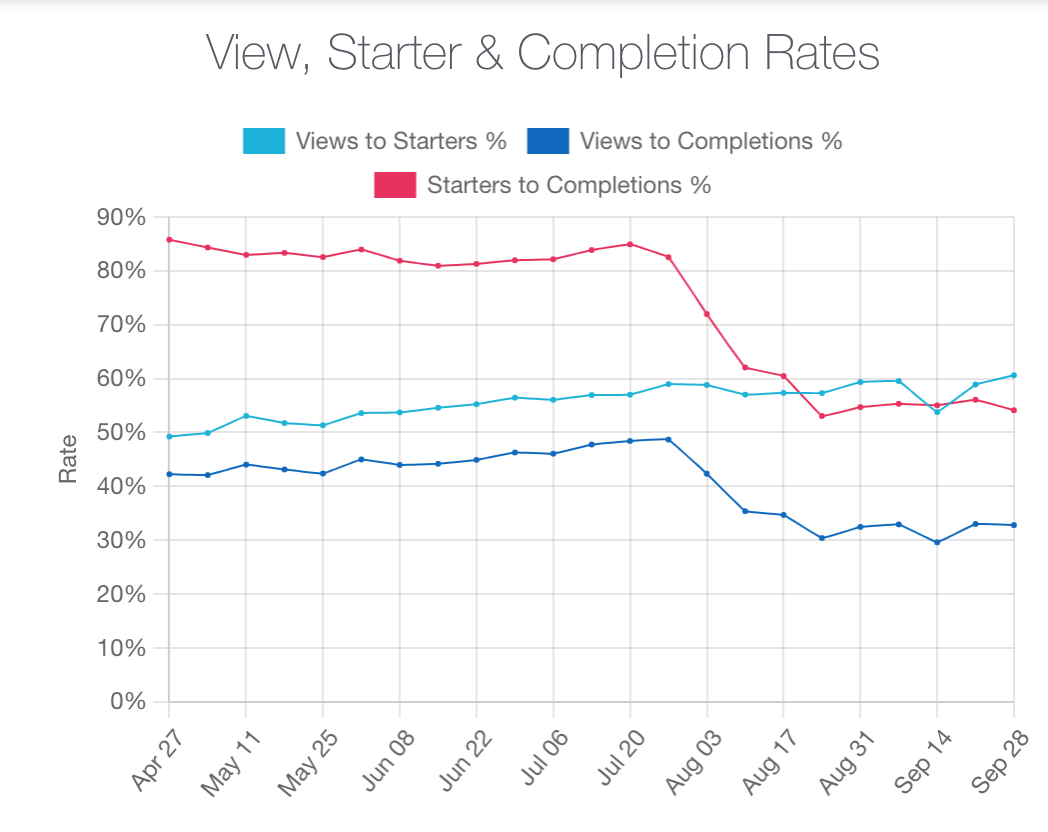
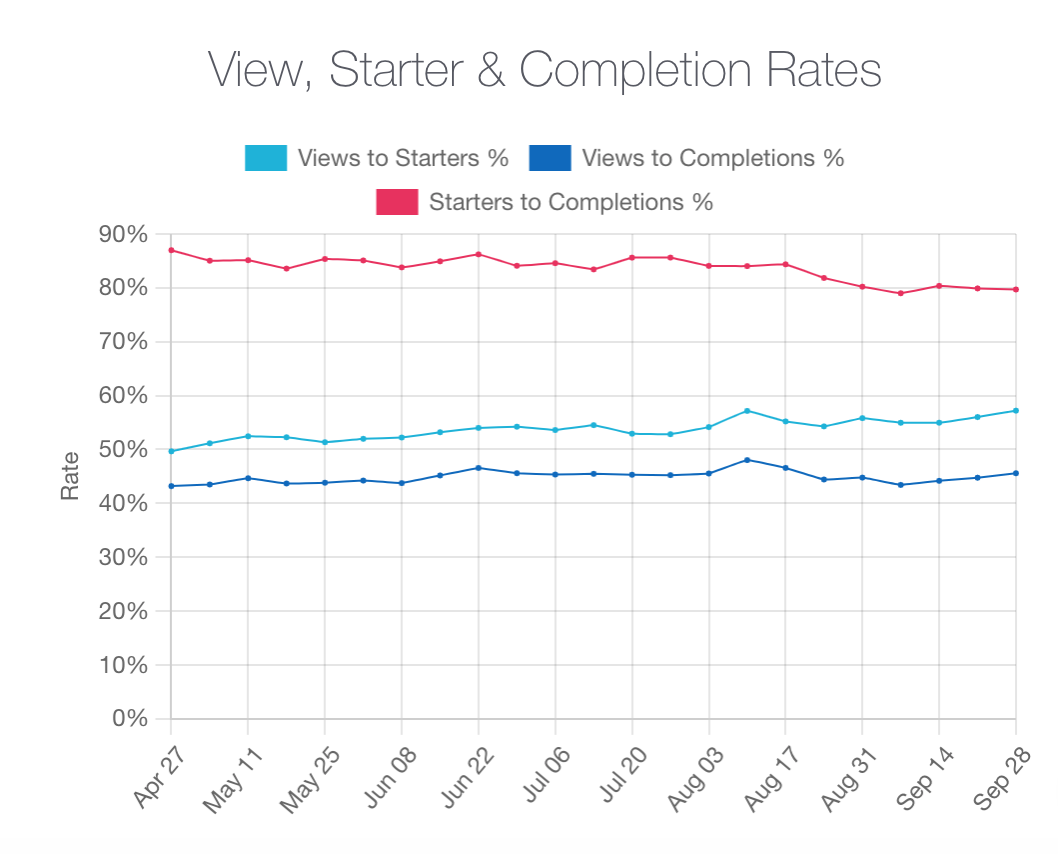
As an example, take a look at this graph from Zuko’s dashboard:

If you were to just look at the overall view to completion trend (dark blue line), you may come to the conclusion that the trend is static and nothing much is happening. Breaking this out into start rate (light blue) and start-to-completion rate (red) gives a deeper picture. It shows that the proportion of users who start the form is declining but that this is being masked by the fact that those who do start are converting at a higher rate, hence the flatness of the overall line.
In circumstances such as these you’ll want to use this insight to examine whether:
- There has been a change to the form page that is deterring users from starting.
- Whether the users who are being “put off” starting the form are naturally ones who would never have completed anyway. A classic example of this is when you require some information from users (e.g. passport number). If you make this clear at the start of the form it may prevent some users starting to fill in the form but these are only the ones who would have dropped out anyway when asked for the information later.
- Has there been a change to the form itself that has helped to improve the conversion rate, or is it just due to the reduction in “time-wasters” who now never bother to start the form rather than getting half way through before abandoning.
Time Spent - How long users spend completing the form. Whilst a “long” average time to complete the form is not necessarily an issue (many forms naturally need a bit of consideration), you should still do some additional analysis to be sure of this (see the Field and Segmentation section below).
Field Returns - A field return is when a user completes a field and moves on but, at a later point, comes back to the same field to make a change. This is generally driven by error messages when the form does not accept the answer as valid, but can also be reflective of a question which causes the user to second guess their answer and return to amend it (this is more common with long, open-form, text answers). Generally, the more field returns, the more frustrations users have with a form so you will want to see if this metric is growing, shrinking or staying static.
3. Establish a benchmark
What is a “good” figure for one of your metrics? This is always a tricky one. Our general advice is that you should only really benchmark your form against itself. Is it performing better or worse after you make any changes?
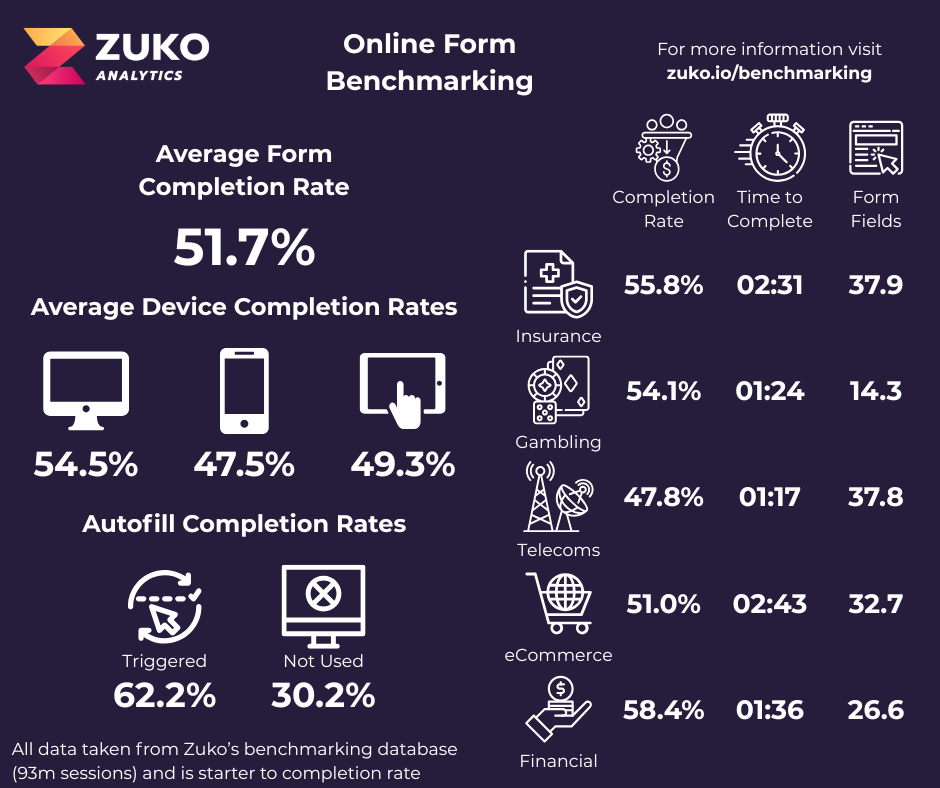
That said, we recognise that benchmarking yourself against others in your sector can be useful as long as you are cautious, and mindful of the fact that no two forms are exactly the same. This is why we have made Zuko’s aggregated data available in an open-source benchmarking repository so you can compare against sector average. This infographic should also give you a good starting point.
4. Delve into the field level data
The greatest insights from a piece of form analysis almost always come when looking at the field level data - which questions are users struggling with?
Important metrics to examine are:
Abandonments - Which fields have the greatest dropout rates (i.e. they were the last field interacted with before the user left)? This gives you a clearer idea of where any problems may lie (although take a look at our guide for certain caveats you need to be careful of). Always look at both absolute numbers (which fields have the greatest volume of abandonments) and rate (which fields have the highest percentage dropout Vs interactions). This will allow you to take account of the fact that questions that are early in the form may have high volumes of abandonments but lower % dropout rates (as they have more people who interact with them).
Error Messages - Tracking which error messages are shown, and how often, is a great way to understand where there may be usability issues with the form as they are directly triggered by a user not being able to successfully enter valid data into a field.
Field Returns - While we have previously mentioned this metric on an aggregate level, it is also crucial to apply it to field-level analysis as it will help reveal the individual questions that users are having issues with.
Time Spent - Again, it is always worth keeping an eye on how much time users are spending on each question. You should be looking at whether (a) the time taken does not tally with what you would expect from your internal testing / expectations, and (b) whether the figure varies for different audience segments (see later).
5. See how the audience flows through the form
Looking at static field-level data should uncover a lot about what is happening with user behaviour in your form. However, looking dynamically at how users move through your form can reveal deeper insight. Tools such as Zuko’s Field Flow feature can map the flow of users so you can see whether they are following the route you would expect or taking an unanticipated diversion.
For example, let’s look at two form flows from Zuko’s Field Flow tool. The first one is what users do after they have interacted with the “First Name” field. Note that the analysed field is on the left and the breakdown of what users do next is on the right.

Unsurprisingly, 90% of users move straight to the next field in the form which, as you might expect is “Surname”. So far, nothing unexpected there. However, move through the form and you start to see this pattern diverge. The next flow chart shows what happens after users on the same form interact with the “Address Search - Postcode” field.

You might expect most user’s next move to be to submit the form. That is indeed the most prevalent action after searching for their address but it only makes up 24% of the “next action” flow. There are a multitude of other fields that people jump to and they are not even address related. Date of birth is the second most popular action which is not how users were expected to journey through the form by its designers. If you see an incongruent pattern like this, it indicates that there is likely to be user confusion, possibly created by the form design so should be investigated more closely.
6. Segment the data
This is straying into more advanced level form analysis but it is so important to business analytics assignments it does need to be mentioned here. While you may have drawn interim conclusions from examining the aggregated data, you should always check whether they apply to the audience as a whole or only to particular segments. Applying this analytical rigour has the additional benefit of potentially surfacing extra insights that will help you improve your form and its completion rate.
Two of the most common, and important ways, to segment the data are:
Abandoned Vs Completed Sessions
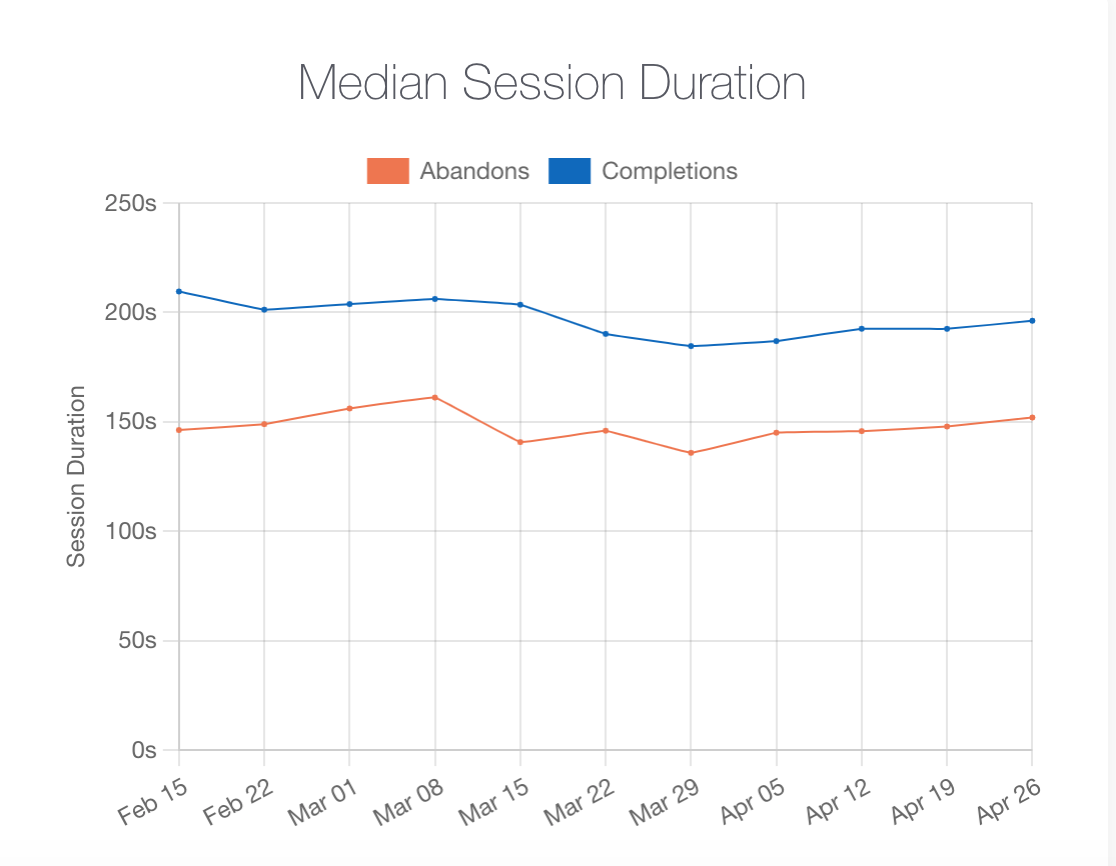
By looking at how users who abandon forms differ from those who complete forms you can draw important conclusions on what may be the root issues with your form. Take a look at these examples showing the average time spent in particular forms.
The first one shows that users who completed the form spent significantly longer in the form than those who abandoned it.
A pattern like this showing that those who abandoned a form did so quickly is usually indicative that (a) the form is so unusable or confusing that users drop out immediately or (b) a segment of the audience you are driving to the form are completely irrelevant or very unlikely to convert so they drop out swiftly after “kicking the tyres” of the form.
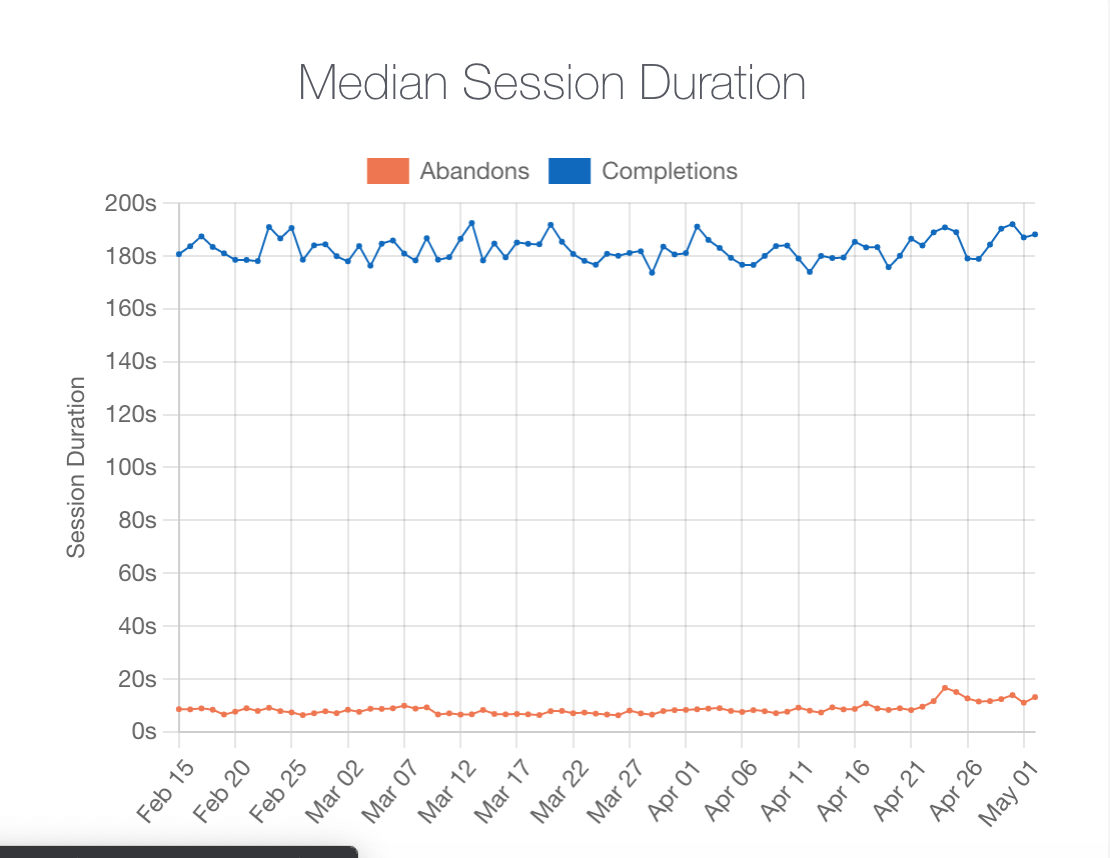
A different pattern with the two metrics being much closer (such as the below) would lead you to draw a different conclusion.
Where users who abandon spend similar amounts of time (or in some cases more time) than those who complete the form, you can reasonably infer that it is the form itself that is causing the abandonment. Users are getting lost. Despite being motivated to start and complete the form they don’t end up doing so, potentially because of a usability issue or difficulties with a particular question.
Traffic Source
Across our years of form analysis experience, we have found that form visitors who come from different traffic sources often behave very differently. In particular, to use a generalisation, “organic” visitors (those that have arrived based on a google search or who put the site URL in directly) have differing behaviour patterns to those driven by paid advertising campaigns. This has become so common that Zuko now has an inbuilt way to track the UTM medium to show where a form's traffic has come from.
For example, look at this graph for a particular form. It seems to show the form’s starter to completion (red) rate drop off a cliff from 85% to 55% as it goes into August. If you see this pattern it may worry you. Could there be an issue with the form that has started to affect performance?
However, the savvy analyst will break out different traffic sources to see if this is a factor. Take a look at equivalent graphs for the form’s organic and paid traffic - what do you notice?

You can see from Graph 2 that the organic traffic conversions have held up pretty well. There has been a slight decrease but it still stands at 80%, much higher than the total average of 55%. It is only when we look at the paid traffic data that we truly see what is going on. It looks like the business has started a paid marketing campaign that began driving traffic to the site in August. This traffic’s starter to conversion rate is around the 40% mark. It is this new influx of a new audience segment that is causing the form’s overall performance rate to decline rather than issues with the form itself (in fact the form hadn’t been changed over this period at all).
Without performing such analysis, the form’s owners may have come to the wrong conclusion and spent a lot of time trying to uncover an issue with the form itself rather than honing in on the real issue - the lower conversion rate of paid traffic - and trying to do something about that.
Whilst the two ways of segmenting the data are probably the most common ones, there are many more advanced ways to segment the audience data and tease out even greater insight (think product, geography, A/B tests among others). They are outside the scope of this article, however, but we will cover the topic in a future blog post.
Next steps
So these are the basics of form analysis. But doing the analysis isn’t much use without action. What’s next? There are dozens of articles on the Zuko blog on how to use this data; and there will be specific follow-ups. As a teaser though, it would not be right to end this article without summarizing the most effective next steps in any form optimization project:
Determine your problem fields - If you’ve followed our guidance and looked at the data in detail, it should be pretty clear which of your form elements are causing user friction and are correlated with abandonment. These are the fields you need to focus your efforts on improving.
Hypothesise solutions - Take a look at the problem fields live in-situ. Try to look at them through users’ eyes (you may want to co-opt some help from a person who has never seen the form before) and, based on the data patterns you see, come up with possible reasons for the user friction. (take a look at some previous examples of form pain points here).
Test and refine - Once you have set your hypotheses you need to test them, ideally one at a time. Make the changes and see how they affect the metrics. You may want to use an AB testing platform such as Google Optimize, Convert or Optimizely to run different form variants at the same time and see which one is the winner.
Plan your improvement programme - You'll need to get the development team involved here and work out a schedule to implement tests and changes - using project management software can help to efficiently plan this using data visualisation tools such as Gantt Charts.
Final thoughts
At one level, form analysis is simple. Follow the steps above and you will likely identify any major issues with your form that can be solved simply. More advanced level optimization, however, requires a greater understanding of user behaviour and work around the whole UX of the form. To learn about some of the common issues you need to be aware of, keep an eye on our blog or download the pdf version of the advanced guide.
Common Questions about Form Analysis in CRO
What is form analysis in conversion rate optimisation?
Form analysis is the process of using data to understand how users interact with a form and where they struggle or abandon. It helps identify issues such as usability problems, unclear copy, or technical errors that prevent users from completing the form.
How do you analyse the performance of a web form?
Form analysis involves looking at user behaviour data to pinpoint friction points, such as where users drop off, encounter errors, or hesitate. These insights are then used to diagnose the root causes of issues and prioritise improvements that will increase completion rates.
What techniques are used in effective form analysis?
Effective form analysis uses a combination of techniques to uncover friction, including: Analysing drop-off rates to identify where users abandon; Reviewing time taken per field to spot hesitation or confusion; Monitoring error rates and corrections to highlight usability issues; Tracking field returns to see where users need to rethink answers
We wrote the book on form optimization!
"The best book on form design ever written - 80 pages of PURE GOLD"


More from our blog:


Want to get started with Zuko?
Start a free trial that includes all features, or request a demo